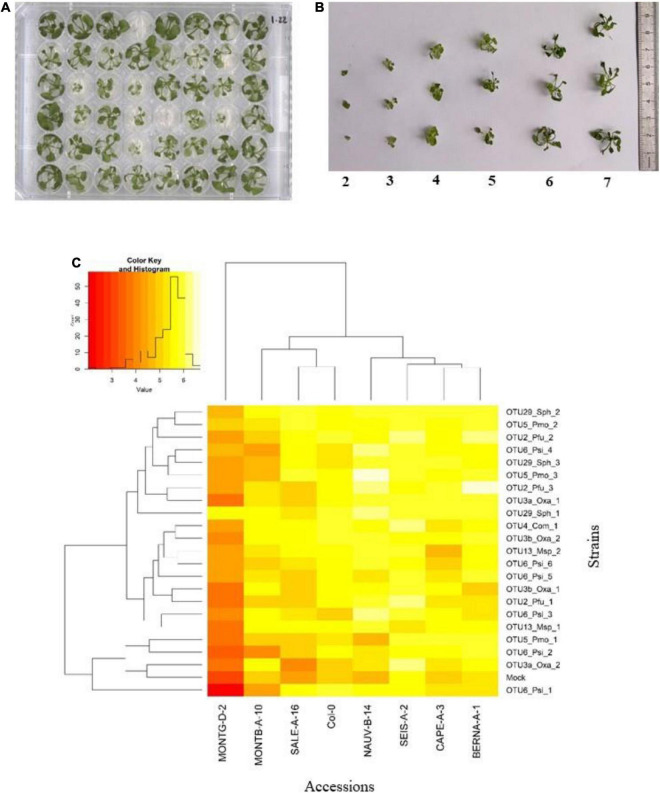
FIGURE 4.
Genetic variation among eight Arabidopsis thaliana accessions in response to 22 bacterial strains inoculated at the seed stage in in vitro conditions. (A) Photography illustrating plants grown in 48-well plates and scored in vitro at 28 dai. (B) Scoring scale of plant development after inoculation at the seed stage, ranging from 1 (very small and/or not healthy plant) to 7 (very well-grown and/or healthy plant). (C) Double hierarchical clustering based on genotypic values, illustrating the genetic variation among the eight A. thaliana accessions in response to the 22 representative bacterial strains belonging to eight OTUs 28 dai. Inner plot: Histogram illustrating the distribution of genotypic values for plant development according a scale from 1 to 7.

