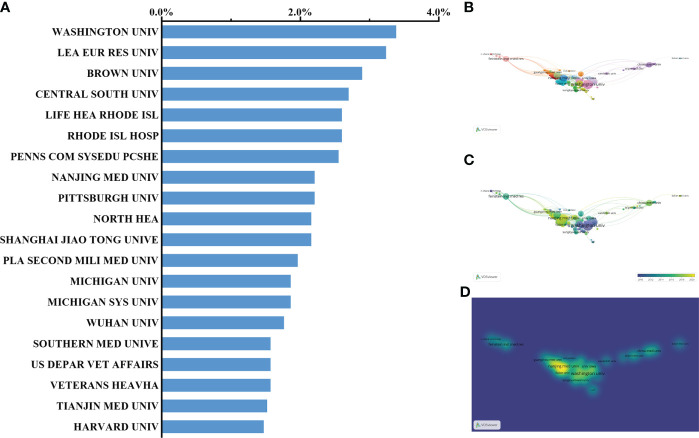
Figure 6.
Distribution of institution-published articles regarding sepsis and programmed cell death. (A, B) Distribution of the top 20 institutions publishing research on sepsis and programmed cell death. (C) The network of collaboration between the top 20 institutions. (D) Distribution of published institutions is presented in accordance with the average time. The blue color represents the early years, and the yellow color represents the recent year.

