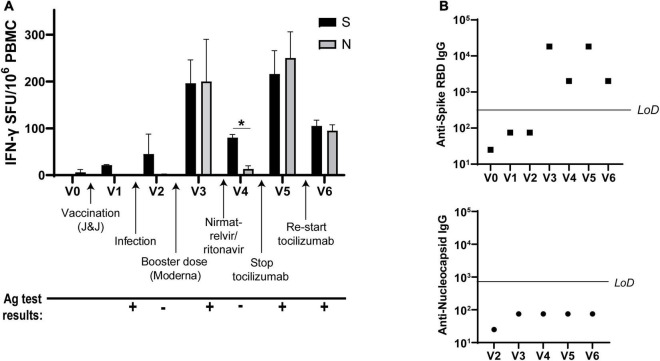
FIGURE 2.
IFN-γ T cell responses to SARS-CoV-2 vary over time. (A) IFN-γ production from SARS-CoV-2 Spike- and Nucleocapsid-specific T cells at each visit as determined by ELISPOT. (B) Spike receptor-binding domain (RBD)-specific IgG titers (top) and Nucleocapsid-specific IgG (bottom) at each visit. LoD, limit of detection. All ELISPOT data in panel (A) from duplicate wells. Data representative of 2 individual experiments, *p < 0.05 by Student’s t-test.

