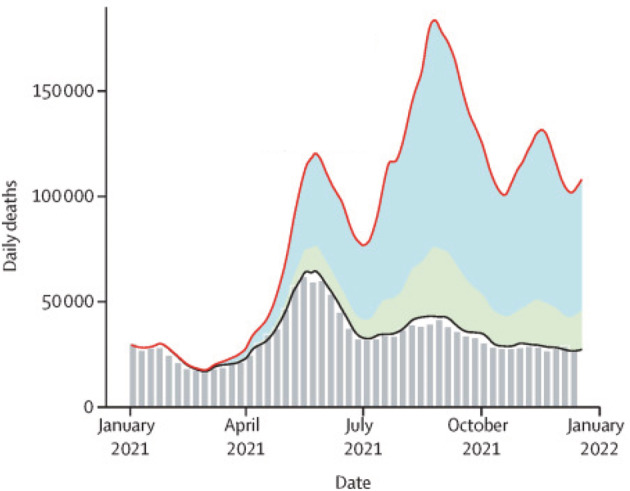
Fig. 1.

Median number of daily COVID‐19 deaths based on excess mortality estimates (grey vertical bars) in the first year of vaccination and modelled numbers of deaths averted. ( ), Excess mortality data; (
 ), model fit to excess mortality; (
 ), model fit without vaccines; (
 ), deaths averted by vaccines (direct); (
 ), deaths averted by vaccines (indirect).
