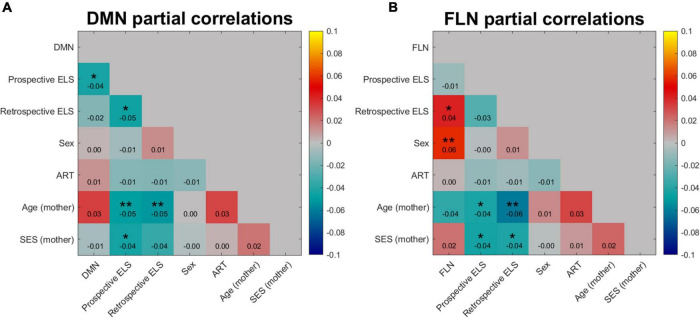
FIGURE 4.
Partial correlation of DMN (A) and FLN (B) network profile dissimilarities with dissimilarity matrices of prospective and retrospective ELS, with participant sex, assisted reproduction treatment (ART) history, mother’s age, and mother’s socio-economic status (SES) partialled out. Colors indicate the strength and direction of correlation between the dissimilarity matrices of variables, where blue represents negative correlations and red and yellow represent positive correlations. *p < 0.05, **p < 0.01.

