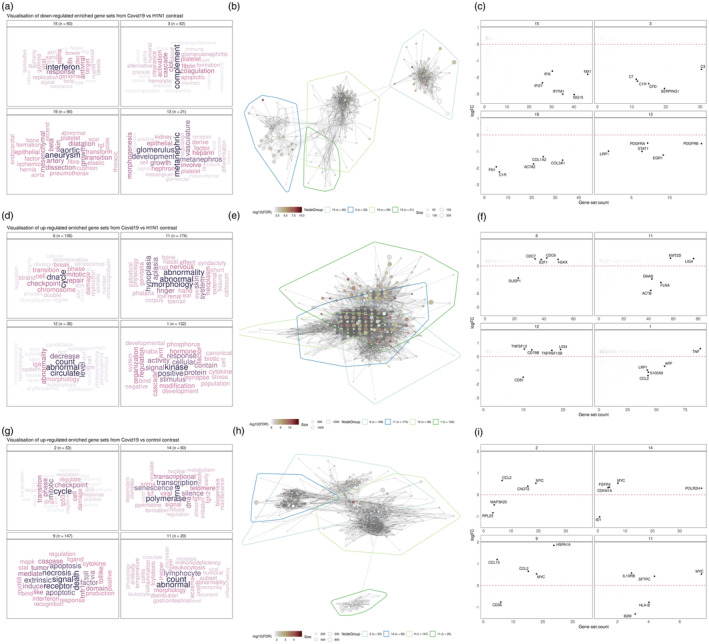
FIGURE 5.

Visualization of significantly enriched gene sets different comparisons. (a, d and g) Cluster annotations based on text‐mining analysis of gene set names. Nine gene set clusters representing biological themes of each comparison are displayed. (b, e and h) Gene set overlap graphs of gene sets enriched in up/downregulated DE genes in different comparisons with nodes representing gene sets and edges representing overlaps based on the Jaccard index. Nodes are coloured based on the significance of enrichment. (c, f and i) Fold change (log2‐scaled) for genes belonging to gene sets in the cluster plot against the number of gene sets in the cluster the gene belongs to.
