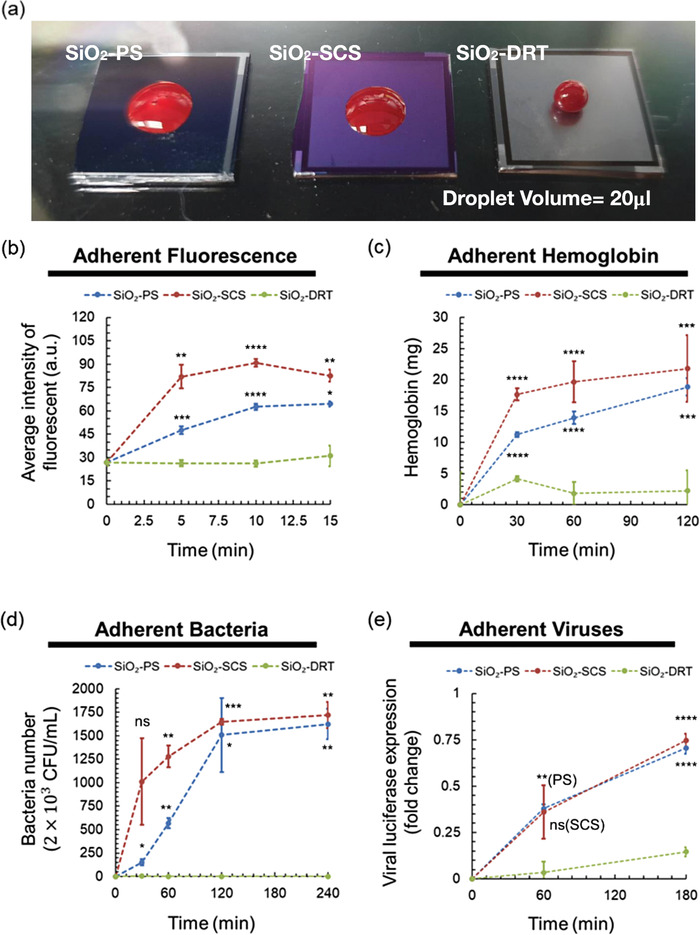
Figure 3.

Antifouling effect of different surfaces. a) Blood was suspended on the DRT surface but not PS or SCS. Quantification of b) adherent protein (n = 3 at each point), c) blood (n = 5 at each point), d) bacteria (n = 3 at each point), and e) viruses (n = 3 at each point) on different surfaces. Data shown in are mean ± standard deviation (SD). Denotation: ns, p > 0.05; * p ≤ 0.05; ** p ≤ 0.01; *** p ≤ 0.001; **** p ≤ 0.0001 versus SiO2‐DRT alone.
