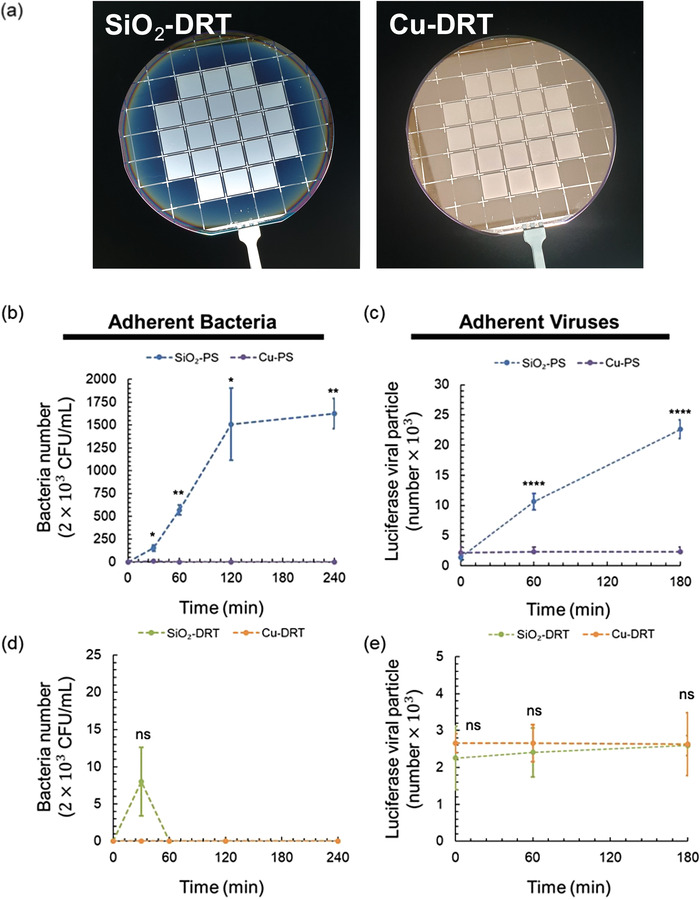
Figure 5.

Comparison of adherent bacteria and viruses on SiO2 and Cu‐coated surfaces. a) The appearance of the SiO2‐DRT and Cu‐DRT surface. b) The adherent bacteria number on the SiO2‐PS and Cu‐PS (n = 3 at each point). c) The adherent viral particle number on the SiO2‐PS and Cu‐PS (n = 6 at each point). d) The adherent bacteria number on the SiO2‐DRT and Cu‐DRT surface (n = 3 at each point). e) The adherent viral particle number on the SiO2‐DRT and Cu‐DRT surface (n = 6 at each point). Data shown are mean ± SD. Denotation: ns, p > 0.05; * p ≤ 0.05; ** p ≤ 0.01; *** p ≤ 0.001; **** p ≤ 0.0001.
