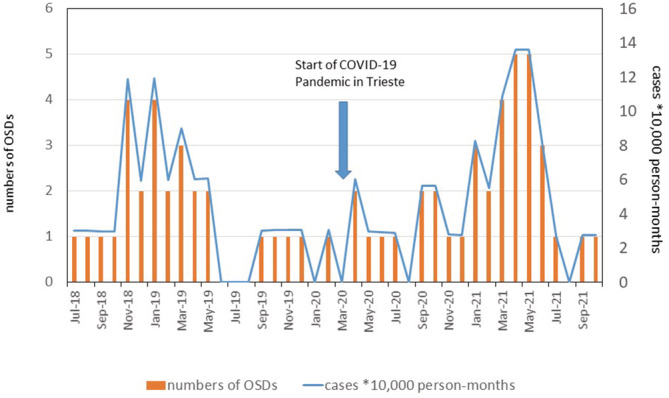
FIGURE 2.

Temporal trend and incidence of cases of contact dermatitis in healthcare workers diagnosed in the period between July 2018 and October 2021: graphical representation of new monthly cases (left axes) and cases per 10 000 person‐months (right axes)
