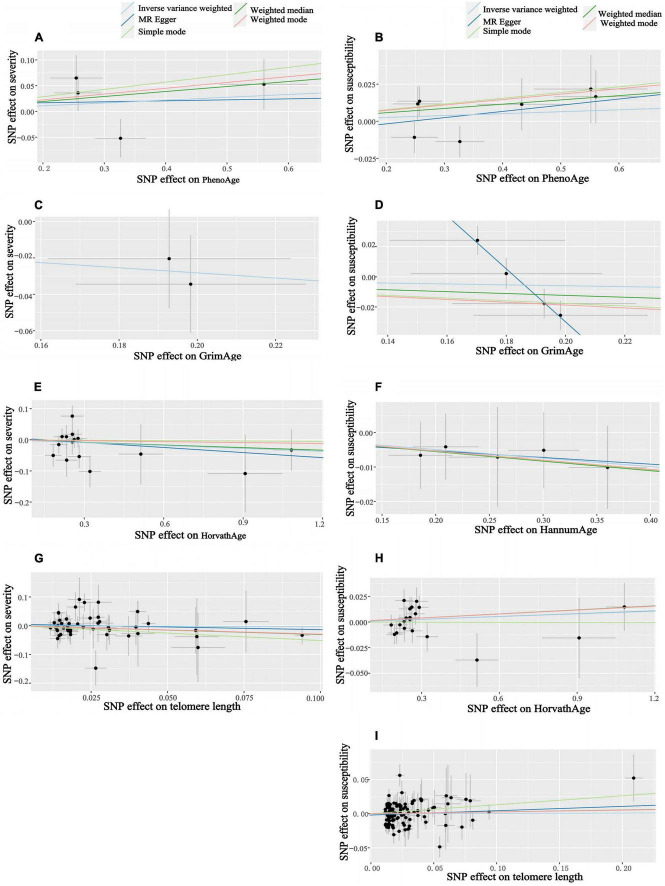
FIGURE 4.
Scatter plots of aging and COVID-19 susceptibility and severity. Horizontal ordinate: SNP effect on “exposure”; Vertical coordinates: SNP effect on “outcome.” (A) Exposure: PhenoAge, outcome: severity; (B) exposure: PhenoAge, outcome: susceptibility; (C) exposure: GrimAge, outcome: severity; (D) exposure: GrimAge, outcome: susceptibility; (E) exposure: HorvathAge, outcome: severity; (F) exposure: HannumAge, outcome: susceptibility; (G) exposure: telomere length, outcome: severity; (H) exposure: HorvathAge, outcome: susceptibility; (I) exposure: telomere length, outcome: susceptibility.

