
Figure 5.
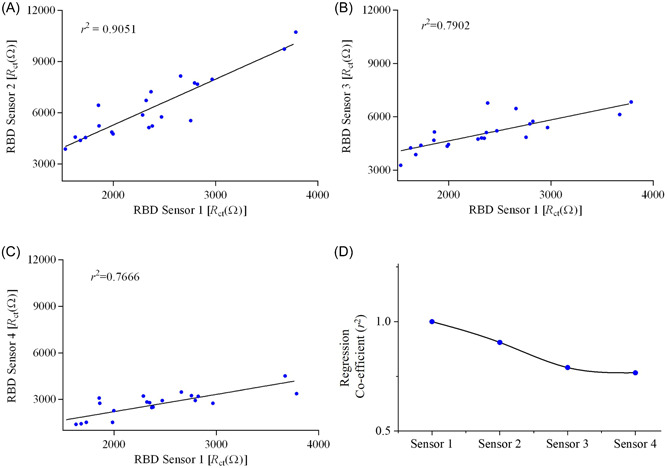
RBD sensor‐to‐sensor variation for detecting SARS‐CoV‐2 antibodies in COVID‐19 samples examined by regression co‐efficient analysis. (A–C) The same samples were tested with four different sensors. Regression co‐efficients (r 2) were calculated for (A) sensor 1 versus sensor 2, (B) sensors 1 versus sensor 3, and (C) sensor 1 versus sensor 4. All responses of sensors are shown in Supporting Information: Figure S3. (D) The values of r 2 are plotted against the sensor number. RBD, receptor‐binding domain.