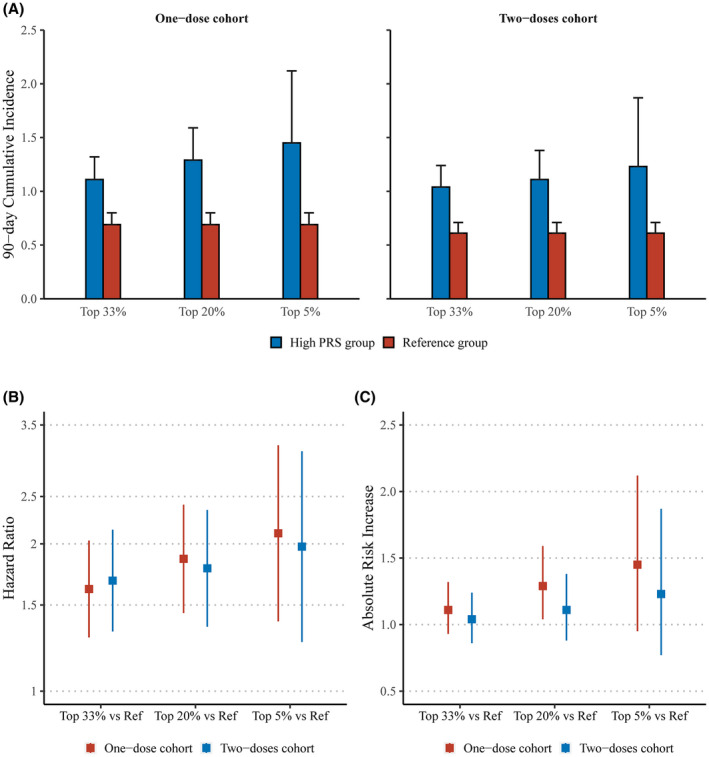
FIGURE 2.

Ninety‐day cumulative incidence (A), hazard ratios (B), and absolute risk increases (C) of three predefined high genetic risk groups vs the reference. Reference: participants with lower 66% PRS. Hazard ratios and absolute risk increases were calculated in comparison with the reference group.
