FIGURE 2.

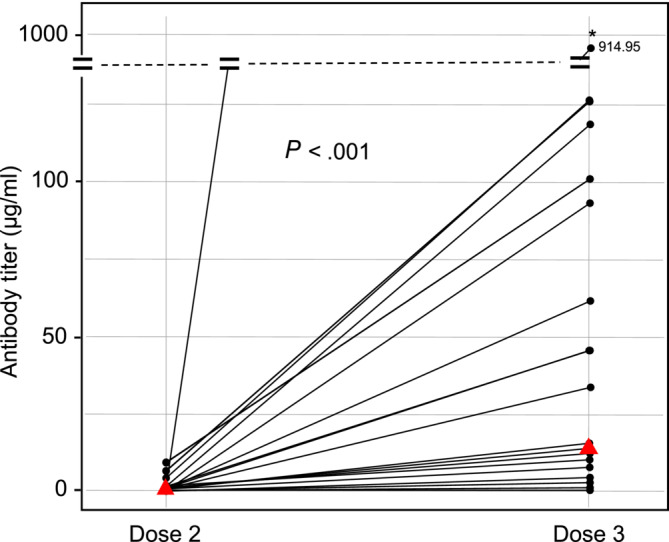
Antibody titers (μg/ml) after two (left) and three (right) vaccine doses. Red triangles denote median values [Color figure can be viewed at wileyonlinelibrary.com]

Antibody titers (μg/ml) after two (left) and three (right) vaccine doses. Red triangles denote median values [Color figure can be viewed at wileyonlinelibrary.com]