
FIGURE 4.
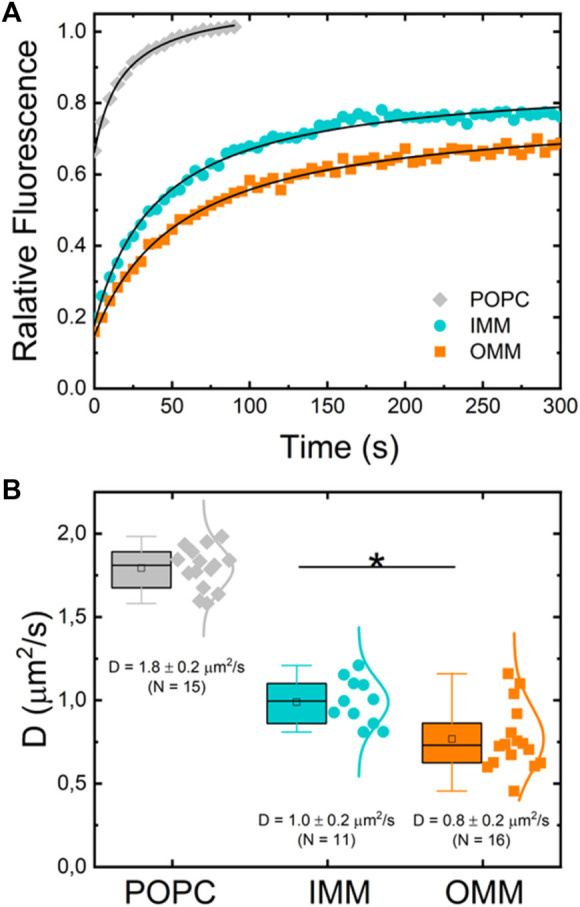
(A) Typical normalized fluorescence recovery curves of supported lipid bilayers of POPC (gray diamonds), IMM lipid extract (cyan circles) and OMM lipid extract (orange squares) supplemented with 0.1% mol of fluorescent lipid RhPE. (B) Diffusion coefficient of RhPE in POPC (N = 15), OMM (N = 16), and IMM (N = 11) lipid bilayers obtained from FRAP curves.