
FIGURE 6.
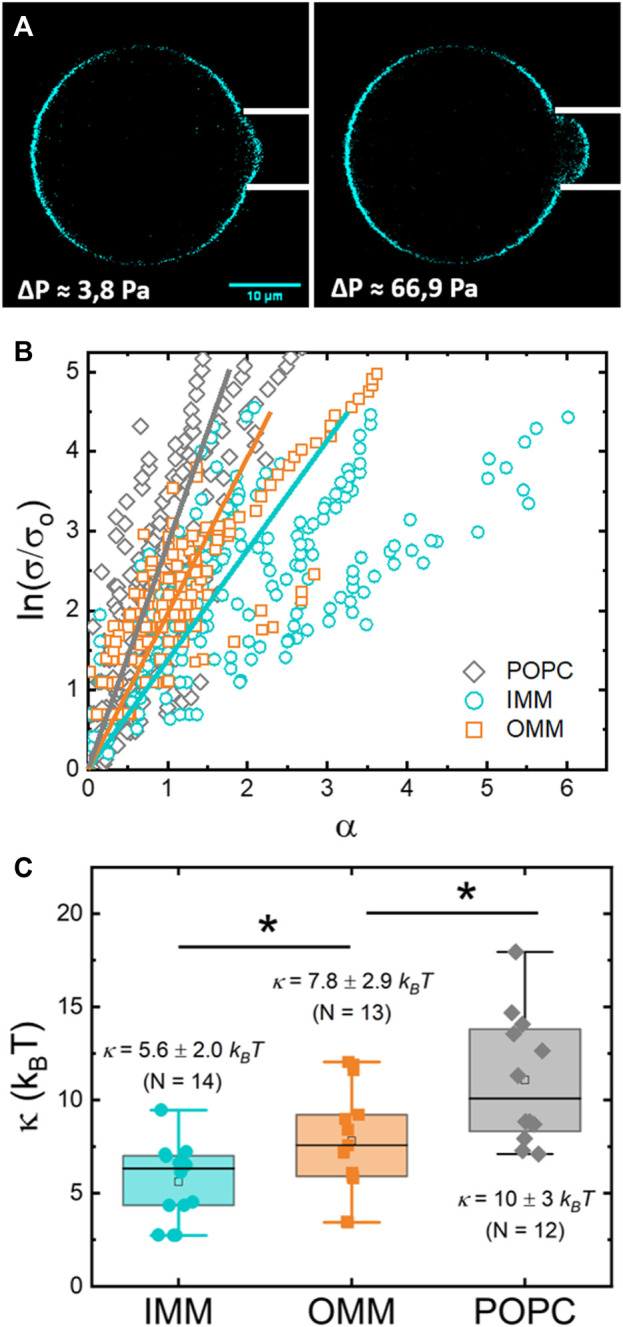
(A) Confocal micrograph of a IMM-GUV aspirated in a micropipette at low (left) and medium (right) tension. The change in the length of the protrusion is proportional to the change in the relative excess area . (B) Plot of the logarithm of the relative tension ( ) versus the relative excess area for different POPC-, IMM-, and OMM-GUVs. (C) Box plots comparing the bending moduli for POPC-, IMM-, and OMM- GUVs (N = 12, N = 14, and N = 13, respectively). The median is represented with a line; the box represents the 25th–75th percentiles; and error bars show the 5th–95th percentile. Statistical significance: * (p ≤ 0.05).