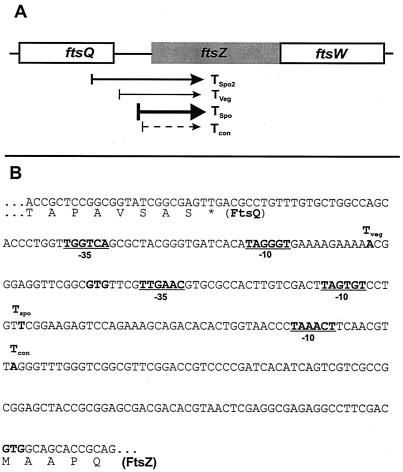
FIG. 4.
Transcription map of ftsZ from S. griseus. (A) Diagram of four transcripts of ftsZ. The open reading frames at the ftsZ locus are indicated (boxes), together with approximate 5′ ends of transcripts (arrows) as identified by high- and low-resolution S1 nuclease protection studies. The thickness of each arrow indicates the relative amount of each transcript. Tspo, Tspo2, Tveg, and Tcon represent the major sporulation-specific, minor sporulation-specific, vegetative, and constant transcripts, respectively. (B) Locations of the 5′ ends of the two major ftsZ transcripts as determined by high-resolution nuclease protection studies. The 5′ ends of transcripts are marked in boldface. The −10 and −35 regions of promoters are underlined. The C-terminal region of FtsQ and the N-terminal region of FtsZ are shown.

