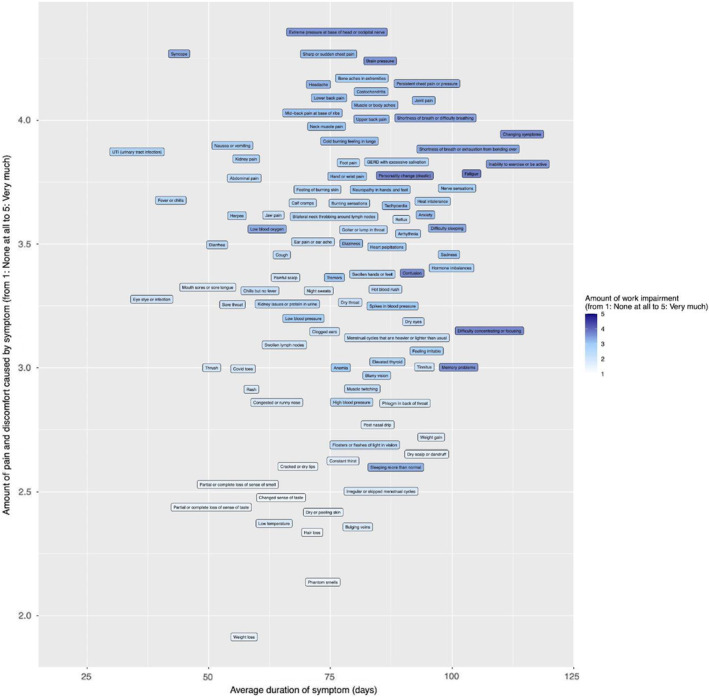
FIGURE 3.

Impact of level of distress and duration of symptoms on ability to work among PASC survivors. Graph showing the effect of duration of symptoms (x‐axis) and level of distress (y‐axis) on ability to work. Darker shades indicate greater impact on ability to work.
