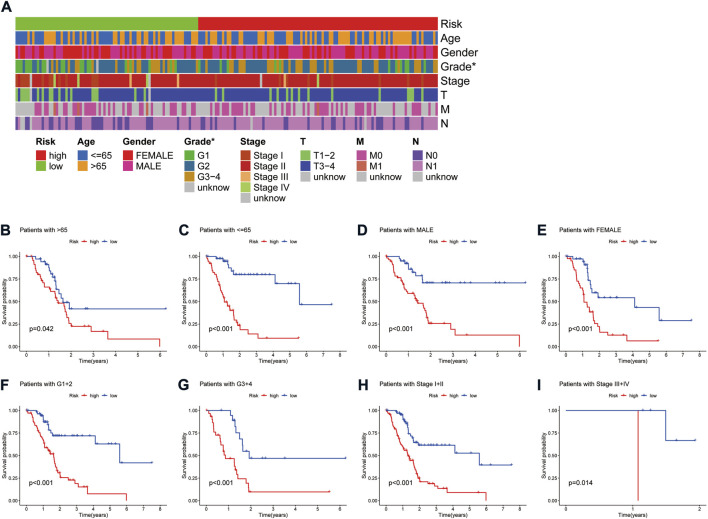
FIGURE 4.
Correlation analysis of the risk signature with clinicopathological parameters. (A) Heat map of the distribution of clinicopathological parameters in the high- and low-risk groups. (B,C) Kaplan-Meier survival curves of low- and high-risk groups sorted by age. (D,E) Kaplan-Meier survival curves of low- and high-risk groups sorted by gender. (F,G) Kaplan-Meier survival curves of low- and high-risk groups sorted by grade. (H,I) Kaplan-Meier survival curves of low- and high-risk groups sorted by TNM stage.

