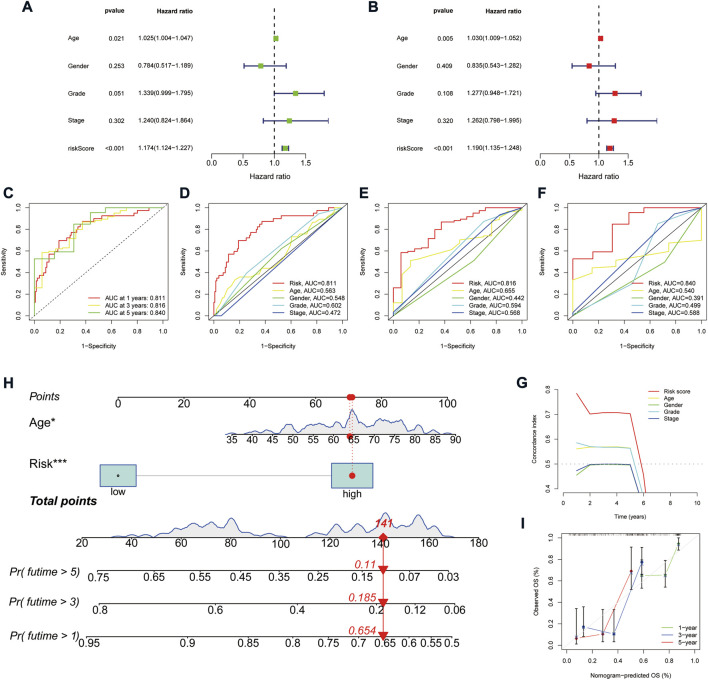
FIGURE 5.
Assessment of the predictive signature. (A,B) Forest plot for univariate Cox (A) and multivariate Cox regression analysis (B). (C) ROC curves of 1, 3, and 5 years survival for the predictive signature. (D–F) Comparison of the prediction accuracy of the risk model with age, gender, grade, and TNM stage at 1, 3, and 5 years. (G) The consistency index analysis curve. (H) Nomogram for predicting the 1, 3, and 5 years survival of patients with HCC. (I) The calibration curves for 1, 3, and 5 years OS.

