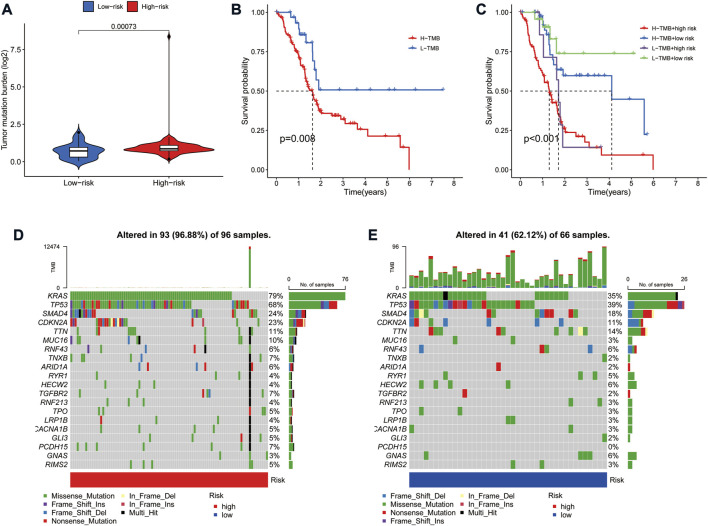
FIGURE 7.
Correlation of risk model with tumor mutation burden in PAAD. (A) Violin plot of TMB status in the high- and low-risk groups (B) Kaplan Meier curve of high-TMB and low-TMB. (C) Kaplan-Meier curve of TMB + Risk. (D) Mutant gene waterfall plot in the high-risk group. (E) Mutant gene waterfall plot in the low-risk group.

