FIGURE 8.
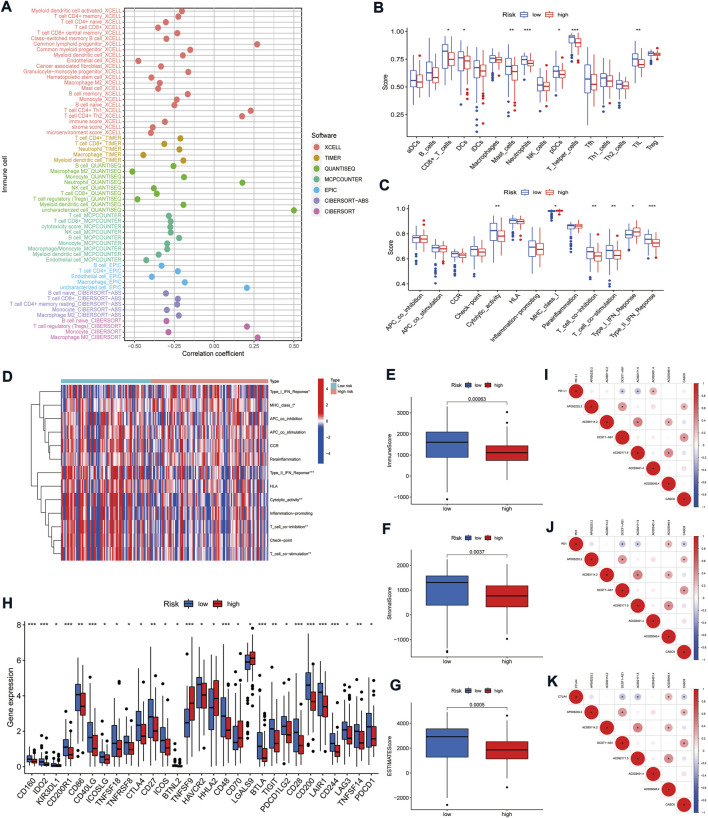
Correlation of the risk model with the immune microenvironment in PAAD. (A) Bubble plot of correlation coefficients between immune cells and risk scores. (B) Comparison of the enrichment scores of immune cells between high- and low-risk groups. (C) Comparison of the enrichment scores of immune-related functions between high- and low-risk groups. (D) Heat map depicting the status of immune-related functions in the high- and low-risk groups. (E–G) Correlation of high- and low-risk groups with immune cell score, stromal cell score, and ESTIMATE score. (H) Comparison of immune checkpoints in high- and low-risk groups. (I–K) Correlation between the expression of three immune checkpoints (PD-L1, PD-1, and CTLA4) and seven signature lncRNAs, respectively. *p < 0.05, **p < 0.01, and ***p < 0.001.

