
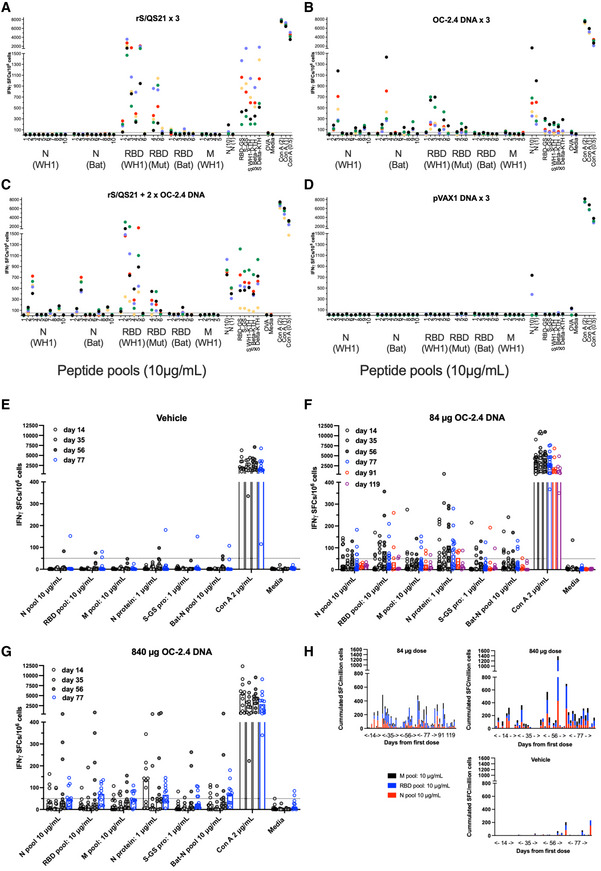
Figure 2. The universal SARS‐CoV‐2 vaccine induces broadly cross‐reactive T cell responses.
-
A–DT cell responses as determined by ELISpot in Balb/c mice immunized three times with either spike protein in QS21 adjuvant (rS/QS21) (A), 50 μg universal SARS‐CoV‐2 vaccine OC‐2.4 (B), primed with rS/QS21 and boosted with two doses of OC‐2.4 (C), or empty pVAX plasmid (D), using in vivo electroporation. Spleens were harvested and individual mice were analyzed for the presence of IFNγ producing T cells using the indicated antigens. Data has been given as the number of IFNγ producing (spot forming) cells (SFCs) per million splenocytes. Each color indicate an individual mice.
-
E–HAlso shown is analysis of T cell responses in New Zealand White rabbits, which were immunized four times with either vehicle only (E), or 84 μg (F) or 840 μg (G) universal SARS‐CoV‐2 DNA vaccine OC‐2.4 using in vivo electroporation. Peripheral blood mononuclear cells (PBMCs) were harvested and analyzed for presence of IFNγ producing T cells using the indicated antigens. Data has been given as the number of IFNγ SFCs per million PBMCs. The dotted line indicates the 50 SFC cut off. Also shown (H) is the cumulated IFNγ SFCs per million PBMCs to the RBD, M, and N peptide pools added together for each group of immunized rabbits (84 μg DNA, 840 μg DNA, and vehicle only) at each time point (day). The numbers on the x‐axis of graphs (A–D) indicates the number of the respective peptide pool (WH1 variant) covering a part of the indicated protein.
Data information: All samples from mice and rabbits were run individually in triplicate and the mean number of SFCs/million have been given (A–G). In (H) the cumulated SFCs from all positive peptide pools from immunized rabbits have been given. The dotted line indicated the 50 SFCs/million cut off.
Source data are available online for this figure.