. 2022 Jul 25;21(10):1608–1621. doi: 10.1158/1535-7163.MCT-22-0059

Figure 3.

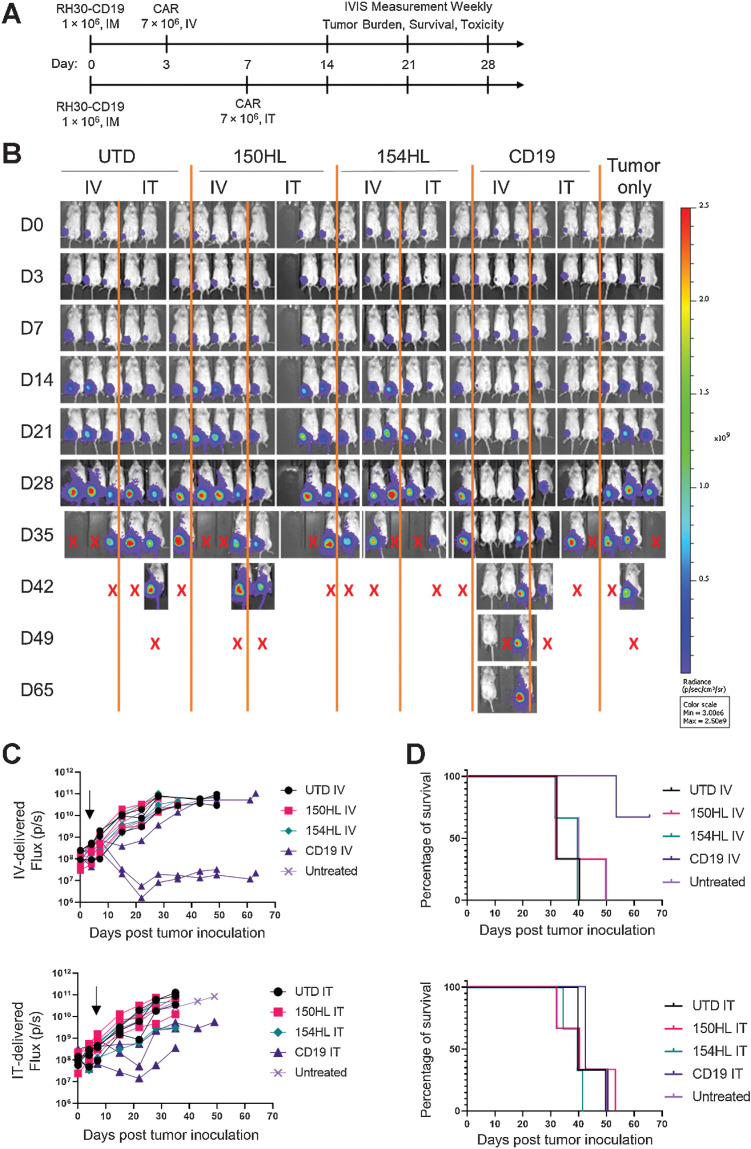
Figure 3. CAR T-cell therapy alone fail to control intramuscular RMS tumors. A, Schematic experimental timeline. Tumors were injected intramuscularly on day 0. CAR- T cells were injected intravenously on day 3 for one group (top line) or injected intratumorally (IT) on day 7 in a separate group of tumor-bearing mice, 7×10⁶ per mouse. The top two anti-FGFR4 CAR candidates, RJ150HL and RJ154HL, as well as CD19 were used for treatment. B, Weekly IVIS measurements was used to determine tumor growth until mice reached endpoint (tumor volume >1,000 mm3). Groups of three mice received CAR T cells IV, IT, or control (UTD). Three mice received tumor only. X indicates sacrifice as per protocol. C, Flux (photons/s) of individual mice treated with either intravenously delivered CAR T cells (left) or intratumorally delivered CAR T cells (right) is plotted. Arrows indicated the time of CAR T-cell injection. D, Kaplan–Meier survival curves for mice receiving intravenously (left) or intratumorally (right) delivered CAR T cells. Two mice treated intravenously with CD19 CAR T-cell survived to day 65.

CAR T-cell therapy alone failed to control intramuscular RMS tumors. A, Schematic experimental timeline. Tumors were injected intramuscularly on day 0. CAR T cells were injected intravenously on day 3 for one group (top line) or injected intratumorally (IT) on day 7 in a separate group of tumor-bearing mice, 7 × 10⁶ per mouse. The top two anti-FGFR4 CAR candidates, RJ150HL and RJ154HL, as well as CD19 were used for treatment. B, Weekly IVIS measurements were used to determine tumor growth until mice reached endpoint (tumor volume >1,000 mm3). Groups of three mice received CAR T cells IV, IT, or control (UTD). Three mice received tumor only. X indicates sacrifice as per protocol. C, Flux (photons/s) of individual mice treated with either intravenously delivered CAR T cells (left) or intratumorally delivered CAR T cells (right) is plotted. Arrows indicated the time of CAR T-cell injection. D, Kaplan–Meier survival curves for mice receiving intravenously (left) or intratumorally (right) delivered CAR T cells. Two mice treated intravenously with CD19 CAR T cells survived to day 65.