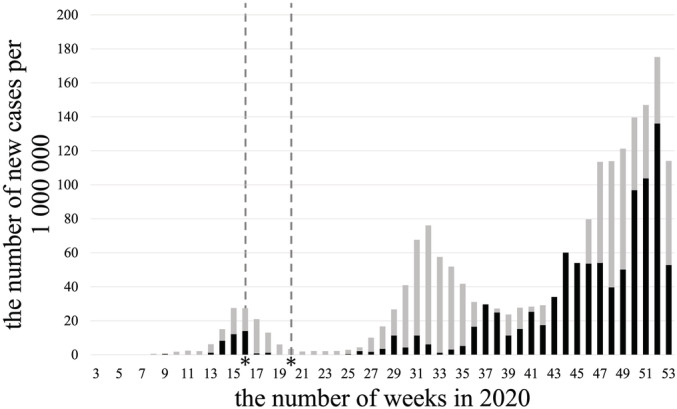
FIGURE 1.

The number of new coronavirus disease (COVID‐19) infections per million population in Miyagi prefecture and throughout Japan in 2020. The asterisks show the start and end of the state of emergency declared by the central government. The light gray bars represent the number of newly diagnosed COVID‐19 cases per week for Japan as a whole and the dark black bars represent Miyagi Prefecture
