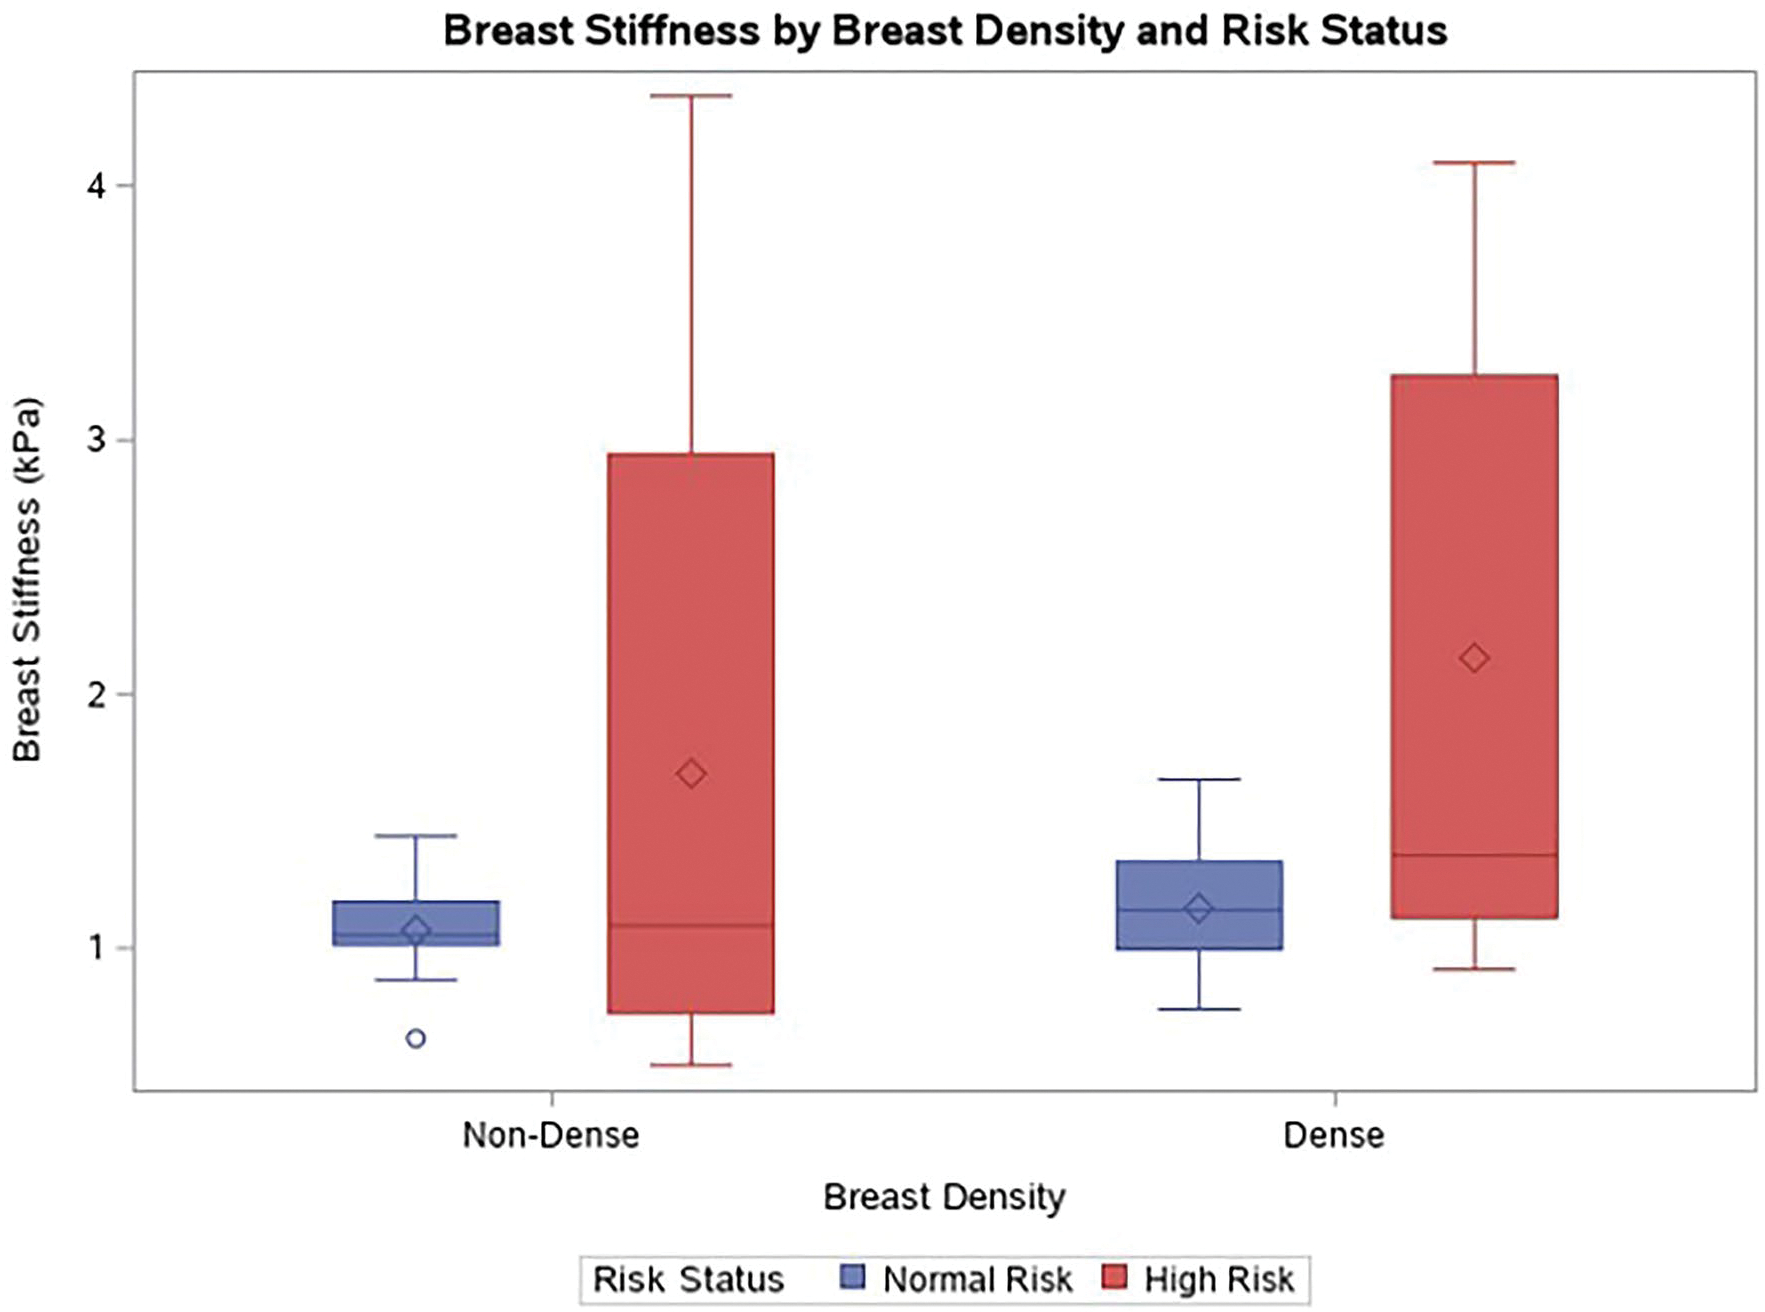
Fig. 3.

Box and whisker plot of breast stiffness (averaged across the left and right breasts) by breast density and risk status. High-risk patients with dense breasts had greater breast stiffness compared to average risk patients with dense breasts. The box represents the interquartile range, the horizontal line within each box represents the median, and the diamond within each box represents the mean
