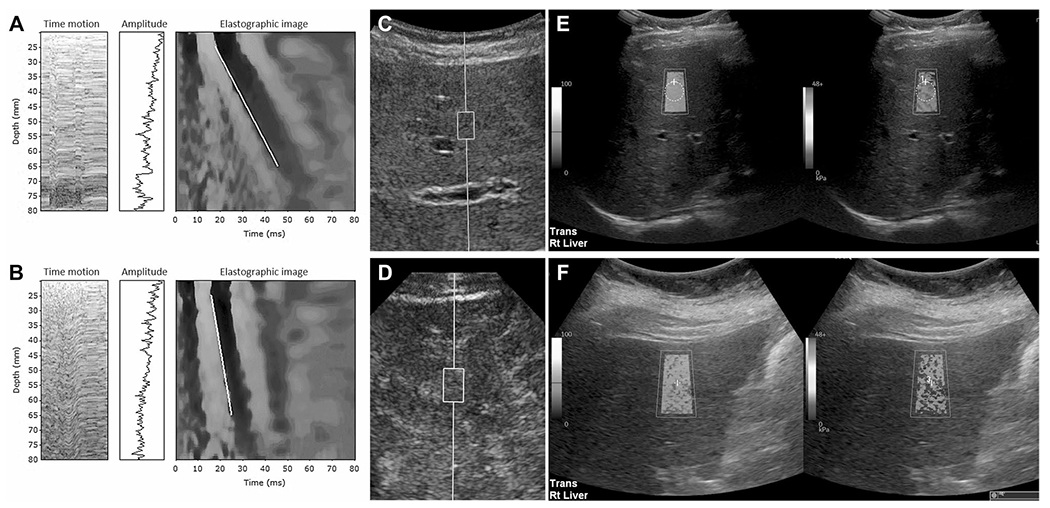
Fig. 6.

Examples of vibration controlled transient elastography (VCTE) (A, B), point shear wave elastography (pSWE) (C, D) and two-dimensional shear wave elastography (2D SWE) (E, F). A VCTE image in a 70-year-old woman with primary biliary cholangitis. The bulk modulus (E) is 5.1 kPa and within normal range. B VCTE image in a 49-year-old male with chronic hepatitis C with E value of 46.4 kPa consistent with cirrhosis. C pSWE image in a 31-year-old female with congestive hepatopathy with measured median velocity of 2.1 m/s corresponding to calculated value of 13.1 kPa consistent with advanced fibrosis and confirmed with biopsy. D pSWE image in a 36-year-old female with post Fontan congestive hepatopathy showing a median velocity of 4.25 m/s corresponding with 54 kPa consistent with biopsy confirmed cirrhosis. E 2D SWE image in a 50-year-old male with known hepatitis C. The median liver stiffness is 5.25 kPa which is within normal limits. F 2D SWE image in 64-year-old female with chronic liver disease of unknown etiology. The median stiffness is 16.7 kPa consistent with advanced fibrosis
