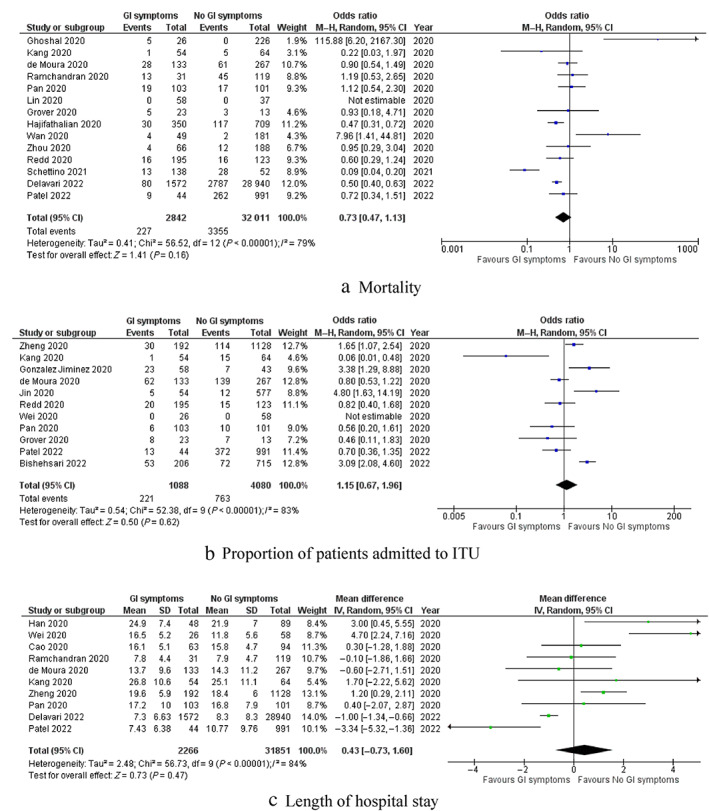
Figure 3.

Forest plots of comparison of (a) mortality, (b) proportion of patients admitted to intensive therapy unit, and (c) length of hospital stay. The solid squares denote the odds ratio or mean difference. The horizontal lines represent the 95% confidence intervals (CIs), and the diamond denotes the pooled effect size. GI, gastrointestinal; M–H, Mantel–Haenszel test
