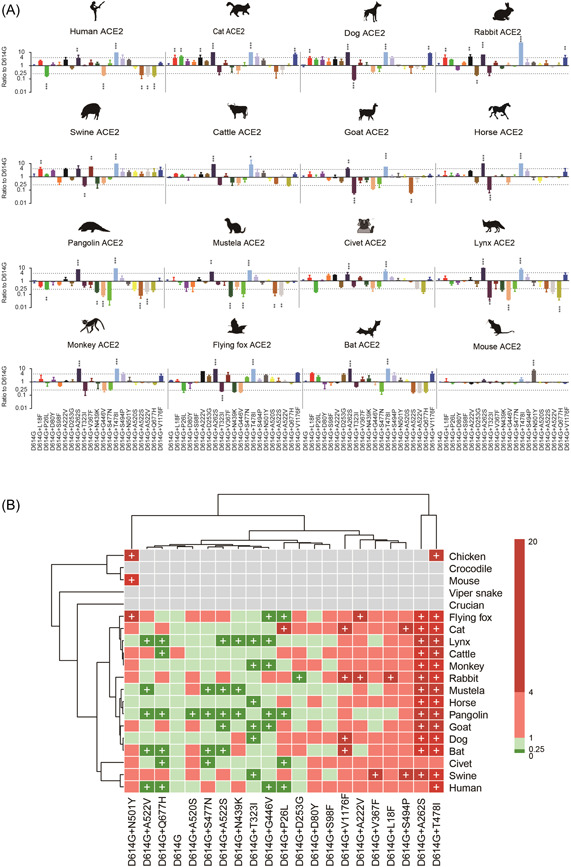
Figure 3.

Infectivity of SARS‐CoV‐2 mutations in cell lines expressing ACE2 proteins from 20 different species. (A) Equal amounts of overexpression plasmids carrying ACE2 orthologs from different species were transfected into Hela cells. Then, cells were infected with the same copy number of SARS‐CoV‐2 variants after quantification. Luminescence signals were collected 48 h later. Ratios between mutants and the D614G reference strain were calculated. The results were obtained from three independent experiments and the values shown indicate means ± SD. Dashed lines indicate the threshold of fourfold difference. *Statistical significance. (B) The heatmap was created by pheatmap package in R program. The color of the square indicates different ratio ranges value, gray indicates that it cannot be infected, red indicates increased infection compared with D614G, green indicates reduced infection compared with D614G, and plus represents the threshold of fourfold difference. The row clustering and column clustering through “complete” methods in pheatmap package and the distance type was set to “correlation.” ACE2, angiotensin‐converting enzyme 2.
