
FIGURE 2.
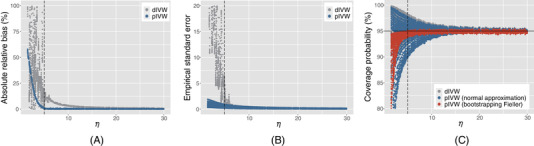
The plots of (A) the absolute relative biases (biases divided by β); (B) the empirical standard errors; and (C) the coverage probabilities of the 95% confidence intervals for the dIVW estimator and the pIVW estimator () against the effective sample size η. The dashed line shows . The dots represent the simulation results under different settings of parameters based on 10,000 replicates. There is no horizontal pleiotropy () or IV selection. This figure appears in color in the electronic version of this article, and any mention of color refers to that version