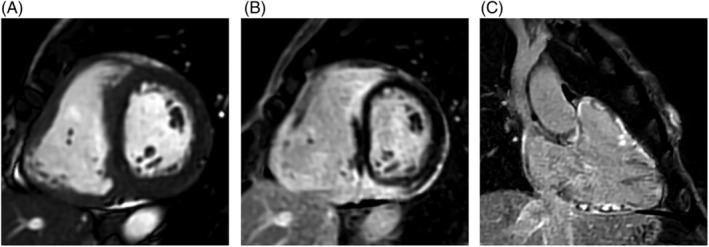
Figure 5.

Cardiac magnetic resonance imaging (MRI) images. (A) Steady‐state free precession (SSFP) sagittal functional image showing a thickened right ventricular myocardium, (B) 2D phase‐sensitive inversion recovery (PSIR) sagittal image showing extensive biventricular delayed enhancement involving mainly the septum and adjacent right ventricle (RV), and (C) 2D PSIR projection of the inflow and outflow tract of the RV showing extensive delayed enhancement involving the RV.
