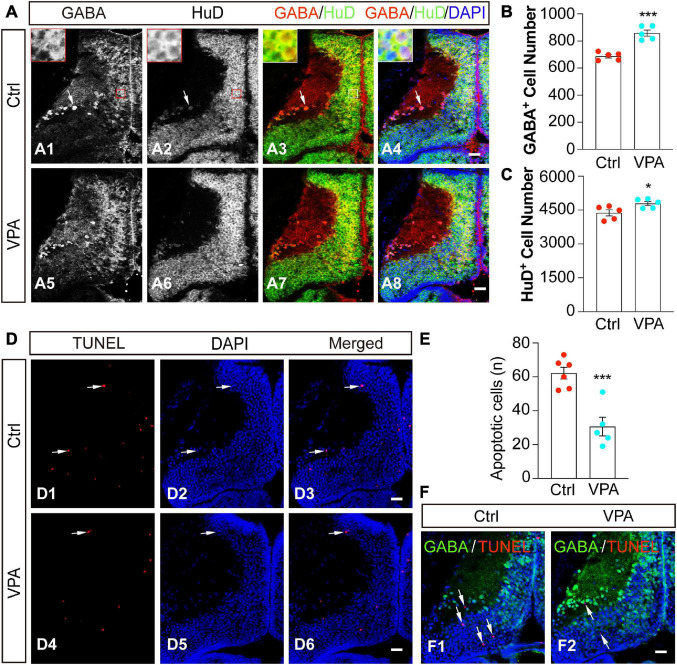
FIGURE 4.
Valproate acid-induced GABA+ cells are HuD+ differentiated neurons. (A) Control (A1–4) and VPA-reared (A5–8) optic tecta were immunostained with anti-GABA and anti-HuD antibodies at stage 48. Red/white lines indicate zoomed-in images showing that GABA and HuD are overlapped in the cell body layer. Arrows indicate that GABA+ and HuD+ cells are distributed in the neuropil. Scale bar = 50 μm. (B) The data shows that the number of GABA+ cells was significantly increased in VPA-raised tadpoles compared to Ctrl. (Ctrl, 688.2 ± 13.3, N = 5; VPA, 858.8 ± 22.3, N = 5; ***p < 0.001). (C) The data shows that the number of HuD+ cells was significantly increased in VPA-raised tadpoles compared to Ctrl. (Ctrl, 4379.8 ± 134.8, N = 5; VPA, 4791.8 ± 89.7, N = 5; *p < 0.05). (D) Representative images of apoptosis in control and VPA-reared optic tecta. Arrows indicate the apoptotic cells. Scale bar = 50 μm. (E) The data shows that the number of apoptotic cells was significantly decreased in VPA-raised tadpoles compared to Ctrl. (Ctrl, 62.2 ± 3.5, N = 6; VPA, 30.6 ± 5.5, N = 5; ***p < 0.001). (F) Control and VPA-reared optic tecta were performed TUNEL analysis and immunostained with an anti-GABA antibody at stage 48. Arrows indicate that the apoptotic cells are not stained with GABA. (Ctrl, N = 6; VPA, N = 7). Scale bar = 50 μm. N represents the number of tadpoles.

