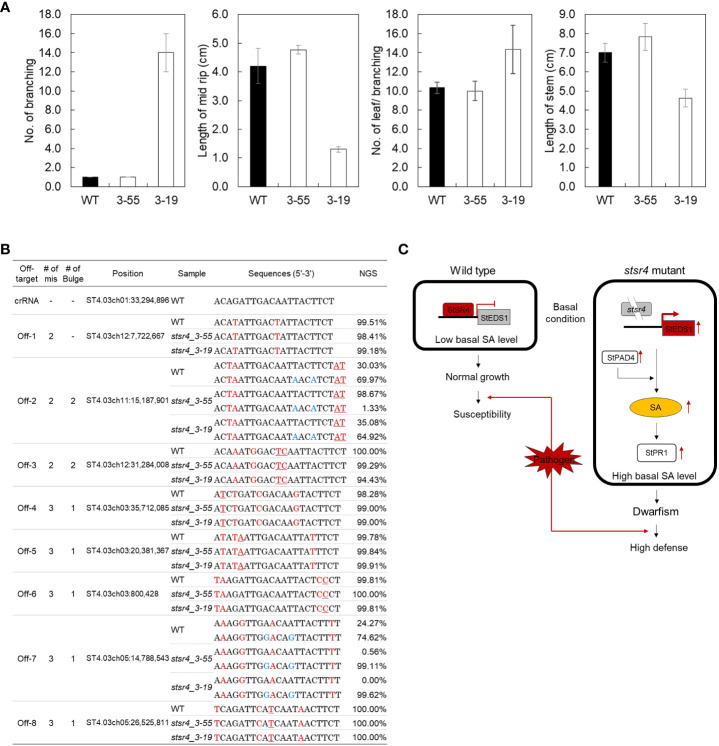
Figure 6.
In vivo phenotype assays and off-target analysis of two mutants showing improved pathogen resistance. (A) Measurement of branch number per plant, midrib length, leaf number per branch, and stem length in wild type and stsr4_3-55 and stsr4_3-19 mutants. The plants were grown in a greenhouse under 16 h light/8 h dark photoperiod for 1 month. Values represent mean ± SE of four biological replicates. Asterisks indicate significant differences (Student’s t-test; *p < 0.05). (B) Analysis of off-target editing in two stsr4 mutants. Eight candidate off-target sequences were analyzed by PCR, followed by targeted deep sequencing (Read counts > 100). The mismatched nucleotides between the on- and off-target sequences are indicated in red, and the bulges are underlined red. Blue sequences represent SNPs. (C) Model explaining the basis of increased SA levels and pathogen resistance in potato, based on the suppression of StSR4 expression, and consequently increased expression of StEDS1 and StPAD4.

