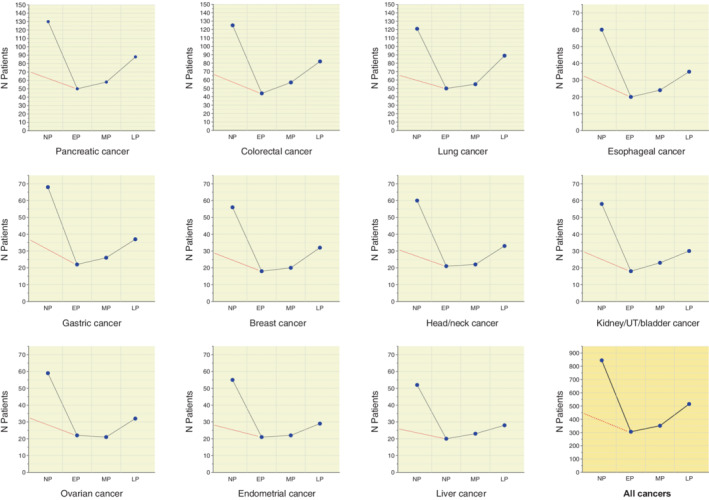
FIGURE 2.

Layout of multiple plots representing the 11 cancers types of the study and their number (blue symbols) over 1‐year nonpandemic and three COVID periods. The red dotted lines in each plot connect the number of cases in the 6‐month nonpandemic period (March to September 2019) to the number in the early pandemic period. EP, early pandemic period; LP, late pandemic period; MP, mid‐pandemic period; NP, nonpandemic period; UT, urinary tract
