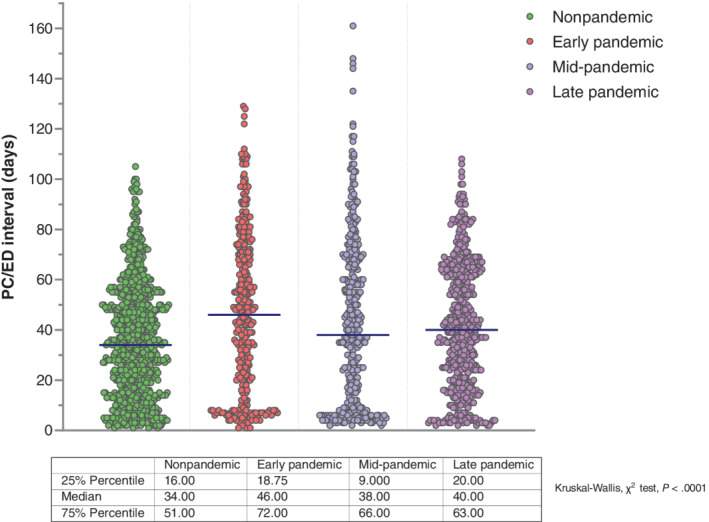
FIGURE 4.

Overall median primary care/emergency department intervals across study periods. The dots in scatter plots represent the values of individual patients and illustrate data patterns when taken as a whole. Median values in each plot are represented by dark blue horizontal lines
