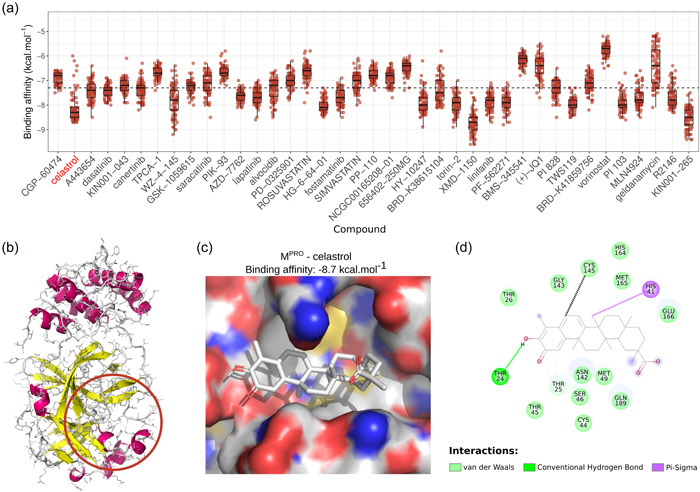
Figure 2.

Docking analysis of molecular interactions between Mpro and molecules capable of reversing SARS‐CoV‐2 genetic signature. (a) Boxplots with the affinity binding energies (kcal. mol−1) were obtained from docking analysis between several structural conformations of 39 molecules and each viral site of 83 Mpro structures. The reverser compounds were sorted based on decreasing order of Q score that indicated their potential to revert the genetic signature of SARS‐CoV‐2 infection. Dotted lines indicate median affinity binding energy (−7.3 kcal. mol−1) considering all investigated drugs. (b) Representative structure of Mpro where atoms are represented as lines and secondary structures as a cartoon with helices highlighted in magenta and sheets in yellow. Colored line circles in brown indicate the binding site region used for docking. (c) 3D and (d) 2D representations detailing configuration and chemical interactions between the best‐ranked pose for celastrol in M.pro 2D target‐drug interaction was constructed using the Discovery Studio® software (version‐2020). The distance between the B‐ring C6 and the sulfur atom of the Cys145 residue, which may be related to a possible Michael adduct formation for the best energy poses in each Mpro structure, ranged from 0.43 to 1.33 nm, with an average value of 0.63 nm (black dashed line). M,promain protease; SARS‐CoV‐2, severe acute respiratory syndrome coronavirus 2.
