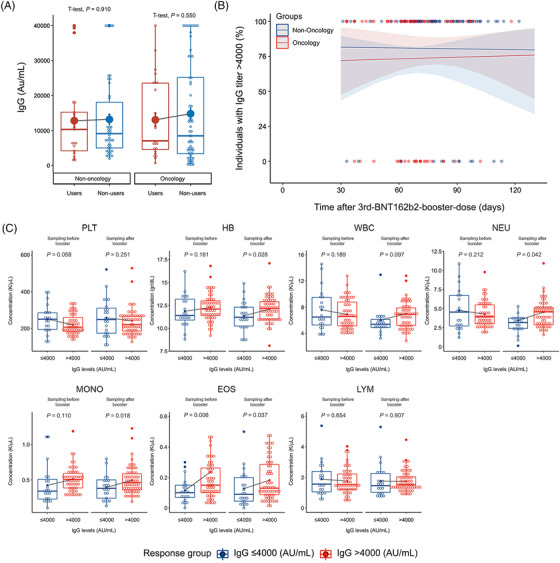
FIGURE 1.

IgG titer levels and CBC parameters over various groups. (A) IgG titers (Au/mL) in relation to two factors of variance, cannabis use (user, non‐users) and cancer status (non‐cancer, cancer). On each box plot, the central mark indicates the median, and the bottom and top edges of the box indicate the 25th and 75th percentiles, respectively. Means are plotted individually using the ‘full dots’ marker symbol. (B) Incidence (%) of high responders (Ig > 4000) over time (days from vaccination to the measurement of anti‐COVID‐19 immunoglobulin G [IgG]). (C) Correlation of CBC levels and cell counts, in relation to two factors of variance, IgG response (high responders > 4000 AU/mL vs. low responders ≤4000 AU/mL) and time of measurement (Sampling before booster BNT162b2 booster dose vs. Sampling after booster after BNT162b2 booster dose). Each box represents a different tested blood component. The left side of each box shows measurements before the BNT162b2 booster dose (Sampling before booster), and the right side shows measurements after the BNT162b2 booster dose (Sampling after booster). Platelet (PLT), Hemoglobin (HB), White blood cells (WBC), Neutrophil (NEU), Monocytes (MONO), Eosinophils (EOS), Lymphocyte (LYM)
