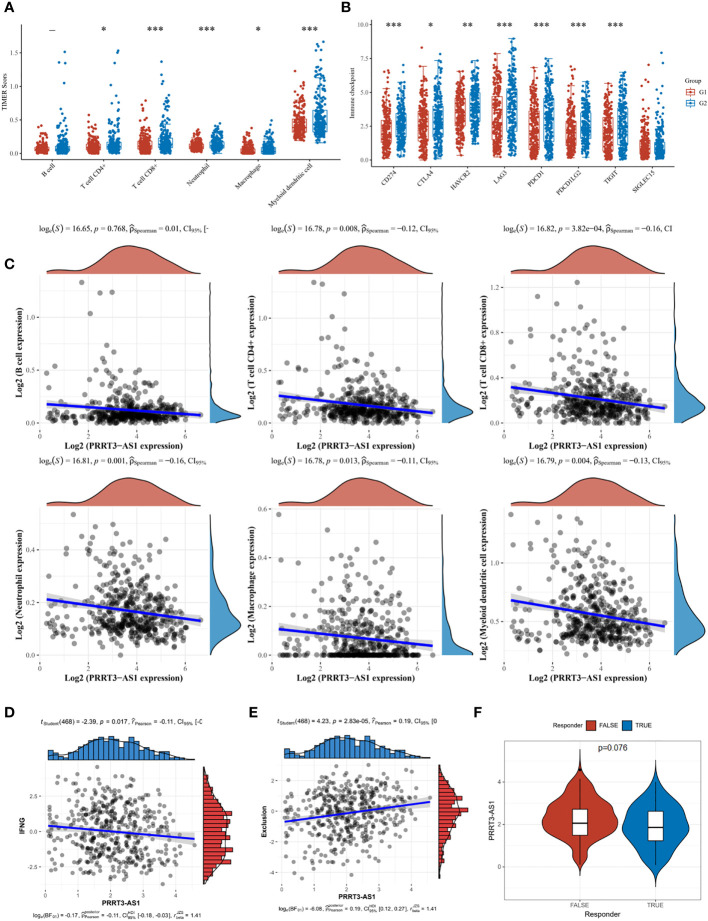
Figure 7.
Immune cell infiltration landscape of PRRT3-AS1 in TCGA-SKCM. (A) Level of immune cell infiltration comparing PRRT3-AS1 high group and PRRT3-AS1 low group. (B) Level of immune checkpoint comparing PRRT3-AS1 high group and PRRT3-AS1 low group. (C) The distribution of B cell, CD4+ T cell, CD8+ T cell, neutrophil, macrophage, myeloid dendritic cell count, and the expression level of PRRT3-AS1. (D) The co-expression of interferon-gamma (IFNG) and PRRT3-AS1. (E) The co-expression of immune exclusion score and PRRT3-AS1. (F) PRRT3-AS1 expression in the immunotherapy response group and immunotherapy non-response group. * P < 0.05, ** P < 0.01, *** P < 0.001.

