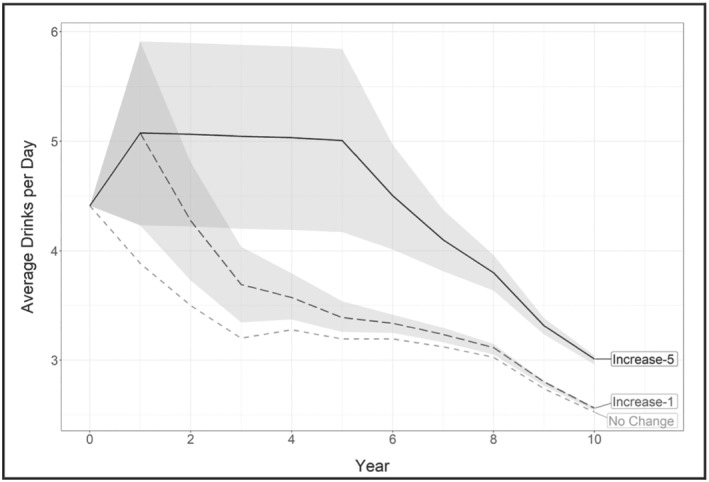
FIGURE 1.

Average drinks per day over the first 10 years by simulation scenario. The shading shows the 95% uncertainty interval for drinks per day (DPD) during the first 10 years of the simulation. Uncertainty diminishes over time once drinking level transition probabilities return to their pre‐COVID levels, because uncertainty intervals in the figure capture the uncertainty related to changes in consumption during the pandemic. With each passing cycle, simulated individuals with alcohol use disorder (AUD) grow closer to the transition probability’s steady state. At the beginning of the simulation (year = 0), the average DPD is 4.4 drinks for all scenarios. In the no change scenario, DPD decreases to 3.2 drinks after 5 years and to 2.5 DPD by 10 years. In the increase‐1 scenario, average DPD increases to 5.1 after year 1, drops to 3.4 DPD by year 5 and to 2.6 DPD by year 10. In the increase‐5 scenario a high drinking level, approximately 5.1 DPD, is sustained for 5 years, dropping to approximately 3 DPD by year 10. Reduced drinking through time results from the long‐term drinking patterns calibrated in the validated model [16], as is also consistent with the general literature that shows that alcohol consumption declines steadily with age [79].
