Figure 5.
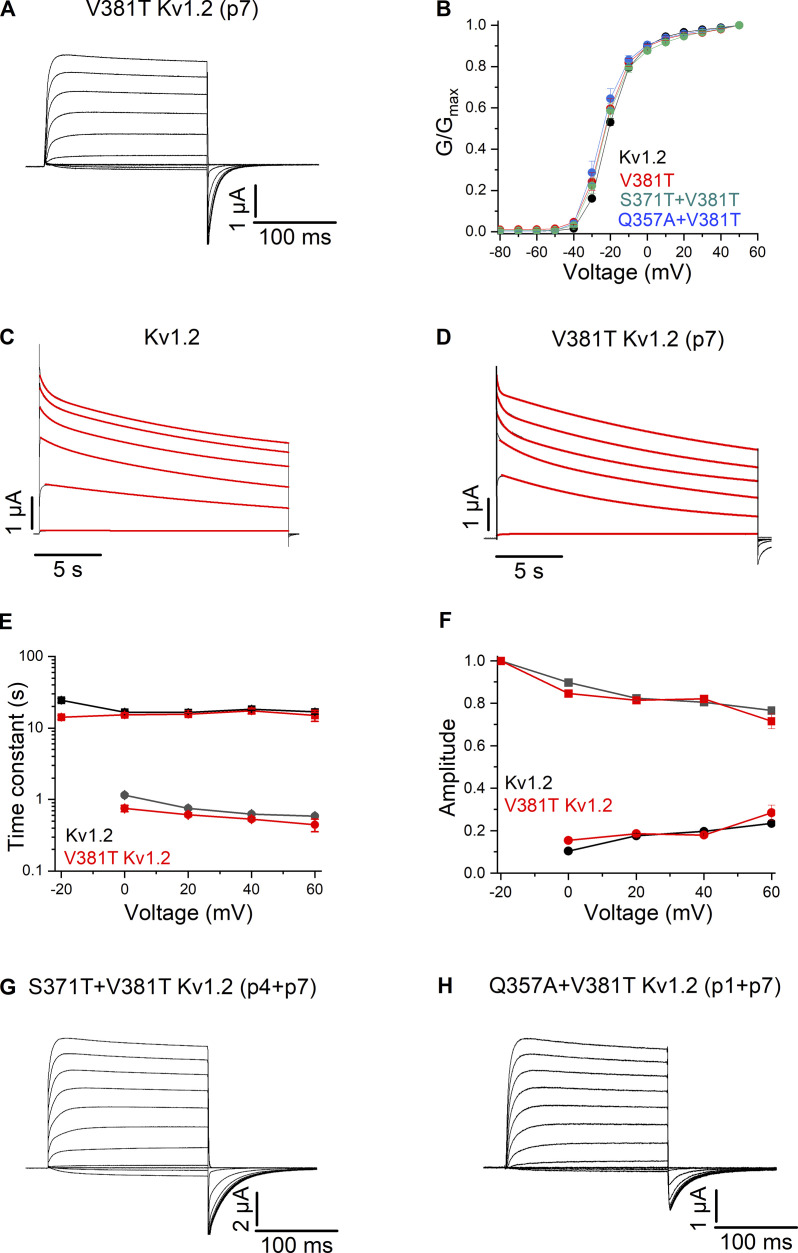
Ionic currents recordings for mutations at p1, p4, and p7 in the Kv1.2 channel. (A) Family of ionic currents for Kv1.2 V381T (p7). (B) G–V relations for Kv1.2, Kv1.2 V381T (p7), Kv1.2 S371T/V381T (p4/p7), and Kv1.2 Q357A/V381T (p1/p7). Normalized G–V relations were obtained by measuring the amplitude of the tail current and normalizing to the maximum elicited following depolarization to +50 mV. n = 5 for Kv1.2 V381T (p7), n = 5 for Kv1.2 S371T/V381T (p4/p7), n = 5 for Kv1.2 Q357A/V381T (p1/p7), and n = 7 for Kv1.2. (C) Currents in response to long (20 s) pulses from −20 to +60 mV in 20-mV steps for Kv1.2. The red curve is the fit of a double-exponential function to the current traces. (D) Currents in response to long (20 s) pulses from −20 to +60 mV in 20-mV steps for Kv1.2 V381T (p7). (E) Inactivation time constants plotted as a function of voltage for Kv1.2 and Kv1.2 V381T (p7). Filled square symbols are slow time constants, and filled circles are fast time constants. n = 7 for Kv1.2 and n = 5 for Kv1.2 V381T (p7). (F) Amplitudes for fast and slow components for Kv1.2 and Kv1.2 V381T (p7). Afast/(Afast + Aslow) are shown as circles, and the Aslow/(Afast + Aslow) as squares. n = 7 for Kv1.2 and n = 5 for Kv1.2 V381T (p7). (G) Family of ionic currents for Kv1.2 S371T/V381T (p4/p7). (H) Family of ionic currents for Kv1.2 Q357A/V381T (p1/p7). All data are mean ± SEM.

