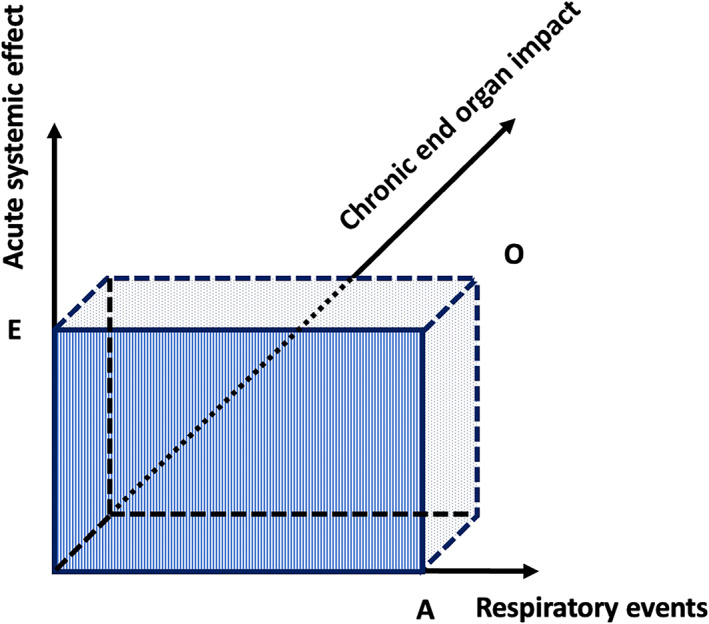
FIGURE 2.

Three‐dimensional model of obstructive sleep apnea (OSA) disease severity. The x‐axis represents the amount of respiratory events (A) in an overnight sleep period. While this number is usually expressed as the apnea–hypopnea index in clinical studies, the absolute count of events is considered in this model. The y‐axis represents an acute systemic effect (E) induced by a respiratory event, e.g. a certain degree of hypoxaemia. The hatched area A*E represents the integration of all events with their associated systemic effects, being the nightly exposure to adverse effects of OSA. The nightly exposure inflicts repetitive strain to the end‐organ systems. The z‐axis represents a chronic end‐organ impact (O) of OSA, e.g. cognitive impairment, arterial hypertension, cardiovascular damage, insulin resistance, etc. Due to interindividual differences in susceptibility, the end‐organ impact may be variable among patients with OSA for similar levels of exposure. The dotted volume A*E*O represents the relation between the three dimensions. Based on postulated differences in susceptibility, the disease spectrum may vary from low exposure/high impact to high exposure/low impact. The dashed aspect of the boundaries indicates that the end‐organ impact of OSA is as yet difficult to assess. This is due to uncertainty regarding susceptibility on the one hand and to possible confounding effects of other disease processes on the other. Figure reproduced from (Randerath et al., 2018) with permission from the publisher
