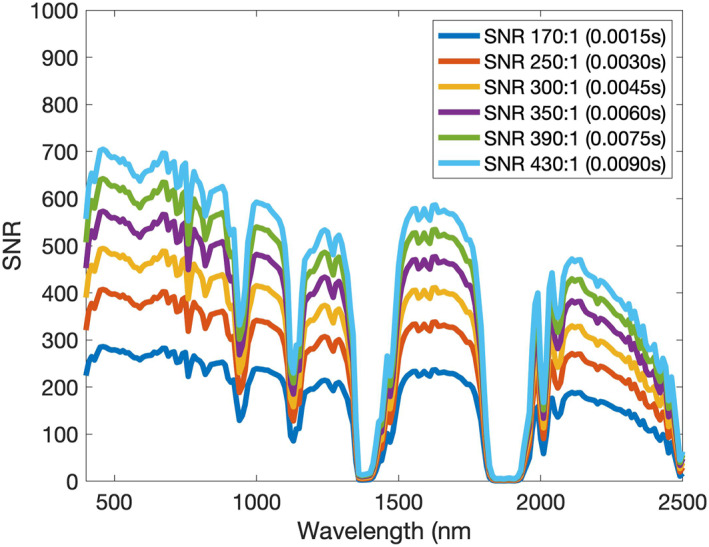
Figure 8.

Signal‐to‐noise ratio (SNR) varies by channel, decreasing at longer wavelengths due to both lower radiance levels and higher noise. Here, the modeled SNR curve at each wavelength is shown for each choice of average SNR (with associated integration time). Note that the intense atmospheric water absorptions (SNR = 0) near 1,400 and 1,900 nm effectively remove all light from the spectrum, and these bands have been removed from the ID analysis.
