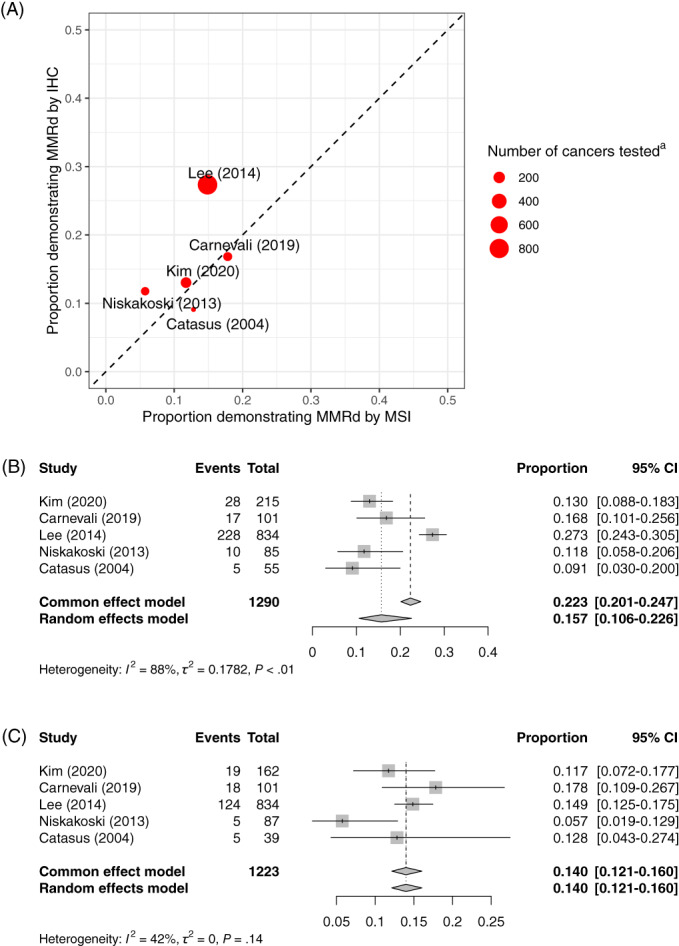
FIGURE 4.

Combined IHC and MSI analysis. (A) Studies conducting MSI and IHC. (B) Forest plot for meta‐analysis of test positivity rate for IHC restricting to studies where unselected MSI was also conducted. (C) Forest plot for meta‐analysis of test positivity rate for MSI restricting to studies where unselected IHC was also conducted. aThis is the number of ovarian cancers tested by MSI or IHC (whichever is lower) [Color figure can be viewed at wileyonlinelibrary.com]
