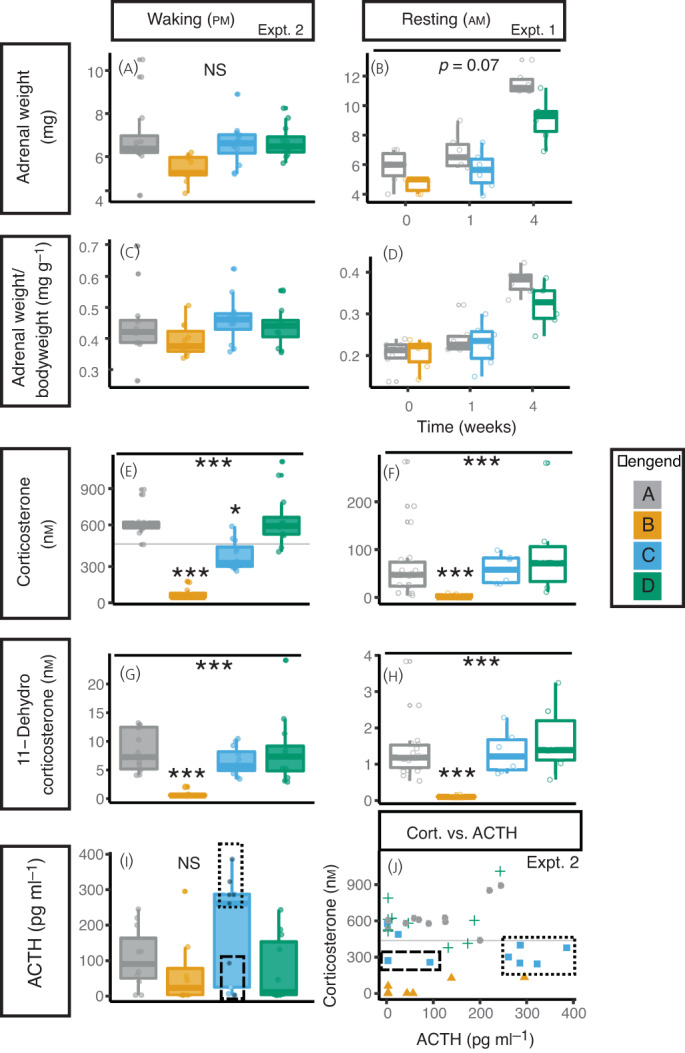
FIGURE 2.

Dexamethasone reduces weight and corticosterone production that persists 1 week following treatment withdrawal. (A,B) Adrenal weight The mean weight of both adrenal glands at collection is presented with box and whisker charts from experiment 2 (A) and experiment 1 (B). (C,D) Adrenal weight/bodyweight (D,E) The adrenal weight as a proportion of bodyweight are presented for experiment 2(C) and experiment 1 (D). (E,F) Corticosterone levels. DEX treatment reduced corticosterone levels that were still reduced 1 week after stopping DEX treatment at waking (pm) (experiment 2) (E), but which had returned to normal basal levels (am; rest period) (experiment 1) (F). Corticosterone levels had returned to the level of controls 4 weeks after stopping DEX treatment. (G,H) 11‐dehydrocorticosterone levels. As (E,F). (I) ACTH levels. Data from experiment 2. The dotted box highlights mice with recovered ACTH production, the dashed box shows mice with unrecovered ACTH production; grey circles in this box are mice with Corticosterone levels below controls, blue circles are mice with corticosterone within the range of controls. (J) Relationship between plasma corticosterone and ACTH. DEX treatment (yellow triangles) reduced both plasma ACTH and corticosterone compared to controls (grey circles). One week after stopping DEX (blue squares), there was greater variation between animals with some showing high ACTH levels but lower corticosterone (dotted box) and some showing inappropriate ACTH levels for the lower corticosterone levels (dashed box). Four weeks after stopping DEX, ACTH and corticosterone levels had returned to level of controls (green crosses). Data from experiment 2. Legend. Grey dots and boxes represent control mice (Group A), yellow those who have had 4 weeks of DEX treatment (Group B), blue those one week after withdrawal of DEX (Group C) and green those 4 weeks after treatment withdrawal (Group D). Data analysed by linear mixed model with group as dependent variable and cage as random factor. Tukey‐adjusted post hoc tests compared to control group are indicated above boxes where significant differences were identified. *** p < 0.001, ** p < 0.01, * p < 0.05. n = 6‐12 animals from 3‐4 cages.
