
FIGURE 4.
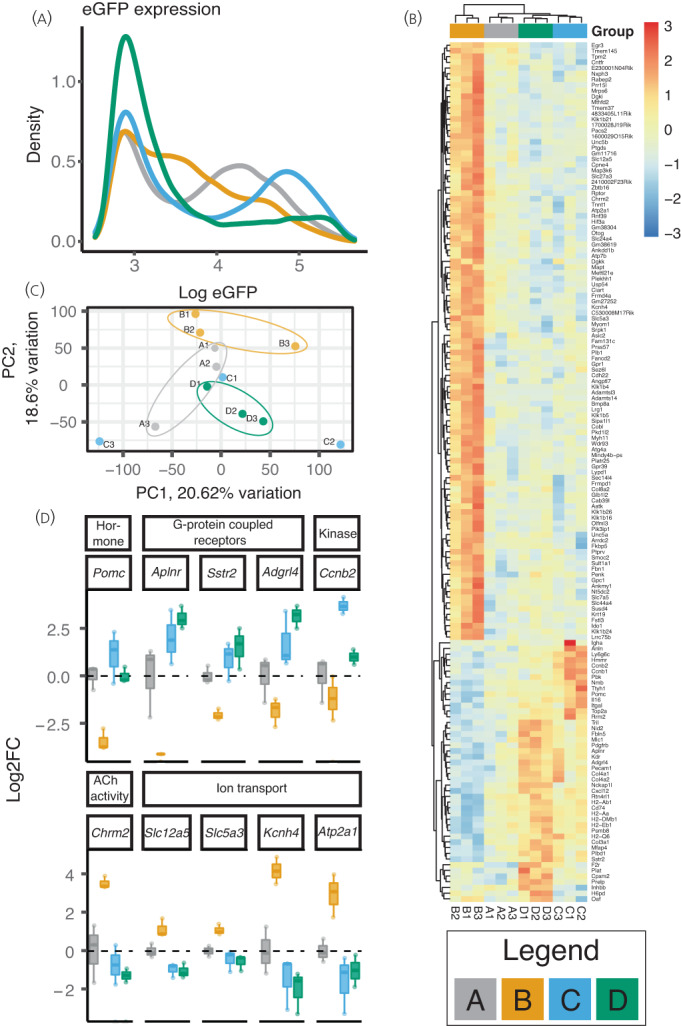
DEX treatment significantly affects the corticotroph transcriptome with changes evident 4 weeks following treatment withdrawal. (A) eGFP expression. The eGFP expression of the isolated cells is shown. In groups A (control; grey line) and C (1 week post DEX withdrawal; blue line) bimodal populations of cells are apparent. The mean fluorescence of three sorts is shown each comprising the dissociated pituitaries of 2‐3 mice. (B) Heatmap showing transcriptomic analysis of isolated cells. The 151 differentially genes with FDR <0.05 are shown. Relative expression across each row is shown as per the colour code to the right of the panel. Columns indicate each sample comprising cells isolated from 2‐3 pituitaries and are clustered according to gene expression pattern. Samples are clustered by Euclidean distance. (C) Principal component analysis (PCA) plot showing the 1st 2 principal components of PCA analysis the RNA‐seq data from corticotrophs following exposure to DEX. (D) Selected genes from RNA‐seq from classes exhibiting persisting changes following withdrawal of DEX. Log2 fold change data are shown for genes that were significantly affected by treatment and recovery along with the molecular function class to which they belong (see table 1 and 2). Data are the same as those presented in 4B. Legend. Grey lines/bars represent control mice (Group A); yellow those who have had 4 weeks of DEX treatment (Group B); blue those one week after withdrawal of DEX (Group C); and green those 4 weeks after treatment withdrawal (Group D). n = 3 comprising a pool of 2‐3 pituitaries.