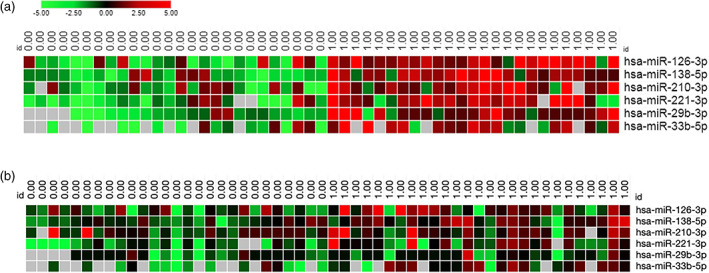
FIGURE 2.

Distinct miRNA expression profile in low and high‐responders. (A) Heatmap of the six miRNAs differentially expressed in low and high‐responders before Tanner score adjustment. (B) Heatmap of the six miRNAs differentially expressed in low and high‐responders after Tanner score adjustment. Each column represents individual samples in each group (0 = low‐responders and 1 = high‐responders) and each row represents an individual miRNA. Expression levels of miRNAs are shown in red (upregulated) and green (downregulated), with brighter shades indicating higher fold differences in relation to the calibrator sample. Lack of difference in expression levels is represented in black
