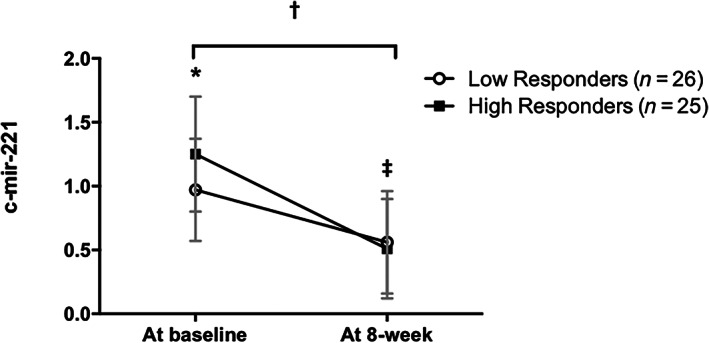
FIGURE 3.

Plasma c‐mir‐221 abundance at baseline and after an 8‐week lifestyle intervention in low and high‐responders (change in 0.32 SDS‐BMI). Data are mean ± SD; p < 0.05; *difference at baseline (p = 0.015); ‡difference pre and post within group (in both groups p < 0.001); †difference pre and post between groups (p = 0.014). Data adjusted for Tanner stage using analysis of covariance (ANCOVA)
