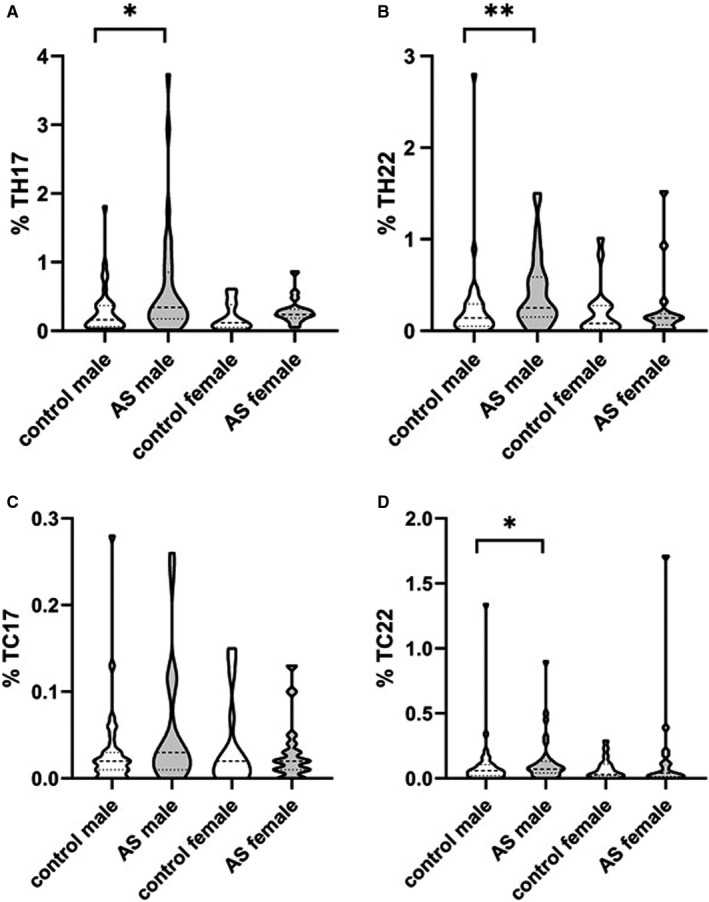
FIGURE 1.

Sex‐wise comparison of the proportions of (A) Th17, (B) Th22, (C) Tc17 and (D) Tc22 cells among peripheral blood leucocytes gated for CD4+ or CD8+ cells according to this figure. Control male n = 33, AS male n = 33, Control female n = 17, AS female n = 17. Dashed lines indicate median and interquartile ranges. Mann‐Whitney U test. *P ≤ .05; **P ≤ .005
