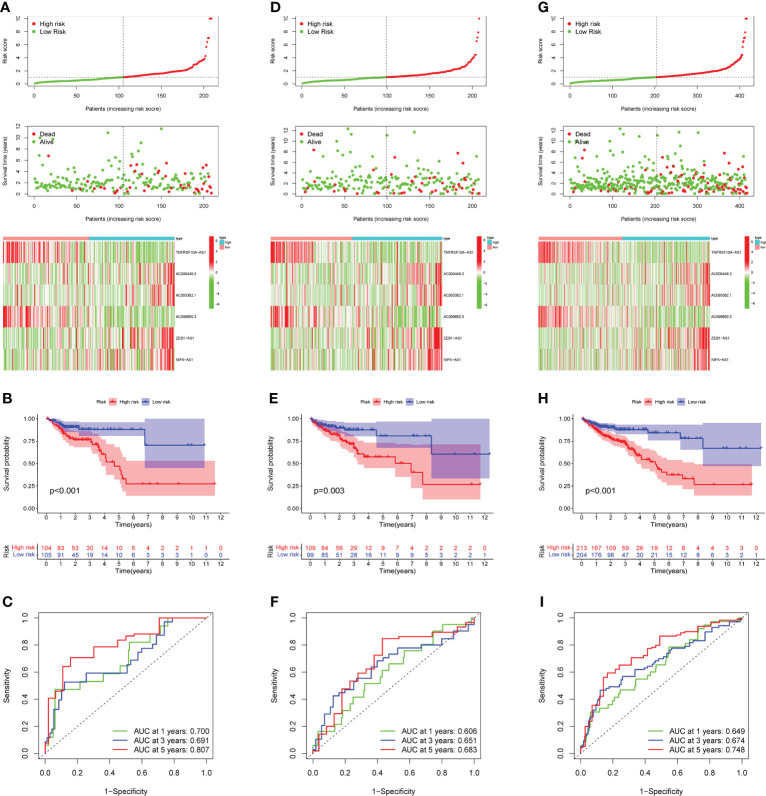
Figure 3.
Prognostic model construction and evaluation. (A) In the training cohort, the patient with different risk score, survival status, and CRLs expression were shown. (B) Survival analysis of training cohort and the prognosis of high-risk group was significantly worse. (C) ROC curve revealed that in the training cohort, the AUC values for 1, 3, and 5-years OS were 0.700, 0.691, and 0.807, respectively. (D, G) In the testing and entire cohort, the patient’s risk score, survival status, and CRLs expression were shown. (E)The high-risk group’s prognosis in the testing cohort was also significantly worse. (F) In the testing cohort, AUC values of 1, 3, and 5-year OS were 0.606, 0.651, and 0.683, respectively, according to the ROC curve. (H) In the entire cohort, survival analysis revealed worse outcomes in the high-risk group. (I) In the entire cohort, the AUC values of the model in 1, 3, and 5-years OS were 0.649, 0.674 and 0.748, respectively.

