Figure 6.
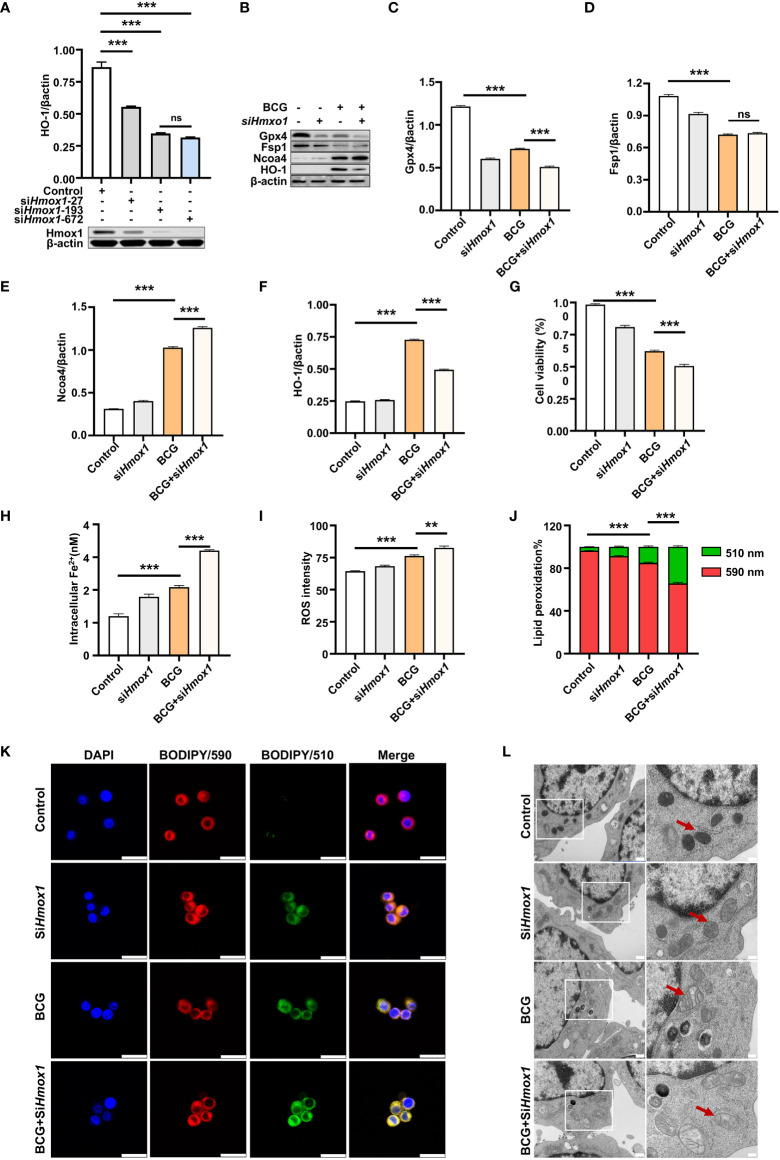
Knockdown of Hmox1 increases BCG-induced macrophage ferroptosis. (A) Representative blots of Hmox1 protein in RAW264.7 cells transfected with siRNA to murine Hmox1 gene. siRNA was transfected by Lipofectamine™ RNAiMAX, and the protein was analyzed at 24 h post-transfection. The si-Hmox1 showed the most efficient knockdown of Hmox1 and was used in subsequent experiments. (B–E) Representative blots (B) and semi-quantitative analysis of Gpx4 (C), Fsp1 (D), Ncoa4 (E), and HO-1 (F) proteins of RAW264.7 cells treated with indicated conditions. The siRNA-mediated knockdown of Hmox1 amplified the inhibition of Gpx4 and Fsp1 expression in cells infected with BCG. (G–J) The viability (B), intracellular Fe2+ (C), intracellular ROS (D), and lipid peroxidation (E) of RAW264.7 macrophages treated with indicated conditions, as determined by Trypan Blue assay, iron ion probes, flow cytometry, and BODIPY 581/591 C11 assays, respectively. (K) Representative fluorescence images of BODIPY 581/591 C11-labeled lipoxidation of polyunsaturated fatty acids in RAW264.7 macrophages of the indicated conditions showed the increase of BCG-induced lipoxidation in cells transfected with siRNA to Hmox1. Cell nuclei were counterstained with DAPI. (L) Representative images of transmission electron microscopy showed mitochondrial membrane ridge breaks (arrows) in siRNA-transfected RAW264.7 and/or BCG-infected macrophages; the right panel shows the enlarged image of the boxed area in its corresponding image in the left panel. Data obtained from three independent experiments were processed using GraphPad Prism 8.0.1 software and ImageJ 1.52.a. One-way ANOVA was used to analyze the differences between groups. All values are presented as mean ± SD (**p < 0.01; ***p < 0.001; n = 3). Bars, 500 nm in the right panel and 200 nm in the left panel of K, and 25 μm in L. ns, no statistical difference.

