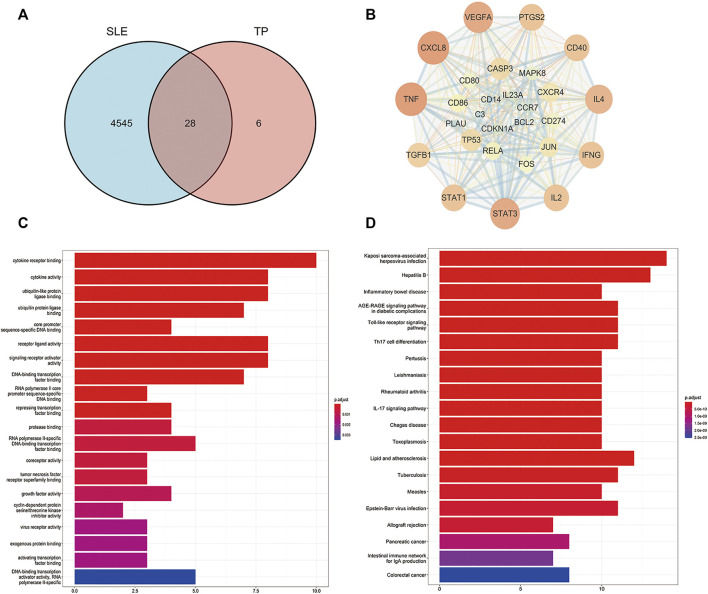
FIGURE 3.
Network pharmacological analysis of the overlapping targets of TP and SLE. (A) Venn diagram of the compound targets of SLE and TP. (B) Visualization of the intersection targets of TP and SLE using Cytoscape 3.7.1 software. The dots represent the target of TP in the treatment of SLE and the edges represent the interactions between targets. (C) Gene ontology (GO) analysis of the overlapping targets of TP and SLE. (D) Kyoto Encyclopedia of Genes and Genomes (KEGG) analysis of the overlapping targets of TP and SLE.

